
Click here to view our video tutorial
Click here to download our PDF tutorial
Business owners juggle numbers from a lot of different places — sales figures, expense receipts, tax records, and profit margins — and keeping it all straight can mean piecing together several spreadsheets or notebooks. Rather than building a tracking system from scratch, Excel 365 offers a simpler solution built right in: ready-made templates you can access in just a few clicks.
One of the most useful of these is the Profit and Loss Statement template, a pre-formatted workbook designed to bring your business’s revenue, expenses, and profit together in one place. It includes a dashboard that summarizes everything automatically, along with dedicated tabs for sales, other income, expenses, taxes, and category labels, so you don’t have to design your own tracking sheets.
In this guide, we’ll walk through exactly how to find the Profit and Loss Statement template inside Excel, create your own copy, and take a quick tour of what each tab has to offer.
Step 1: Open the File Menu
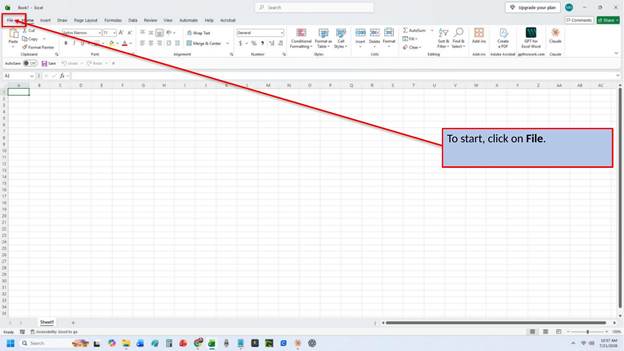
Every new Excel document — including templates — starts from the File menu. With Excel open, look to the top left corner of the ribbon and click on File.
Step 2: Click New
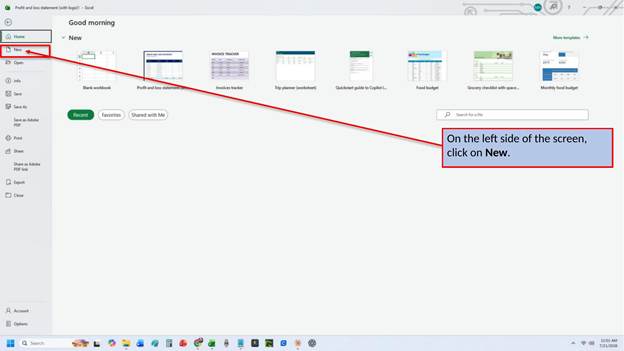
Clicking File opens Excel’s Backstage view, which is where you’ll manage things like opening, saving, and creating documents. On the left-hand side of this screen, click on New. This takes you to Excel’s template gallery, where you can browse a wide selection of professionally designed templates instead of starting from a blank workbook.
Step 3: Search for a Profit and Loss Statement Template
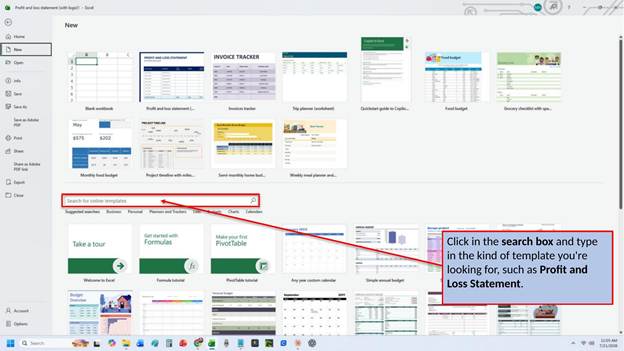
The template gallery includes a search box at the top of the screen. Click inside it and type in the kind of template you’re looking for — in this case, Profit and Loss Statement. Excel’s search isn’t limited to financial templates, either; you can use this same search box to find templates for budgets, calendars, invoices, and dozens of other everyday tasks.
Step 4: Run Your Search
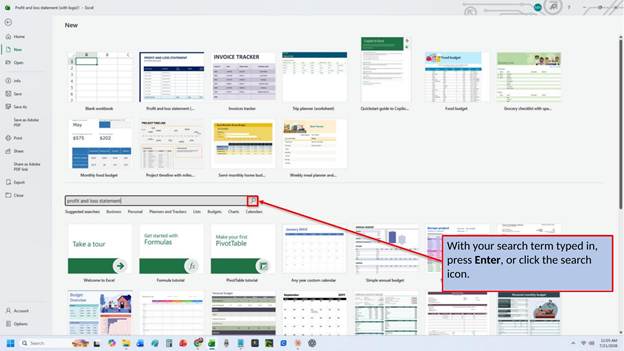
Once you’ve typed in your search term, press Enter on your keyboard, or click the magnifying glass icon next to the search box, to see the results.
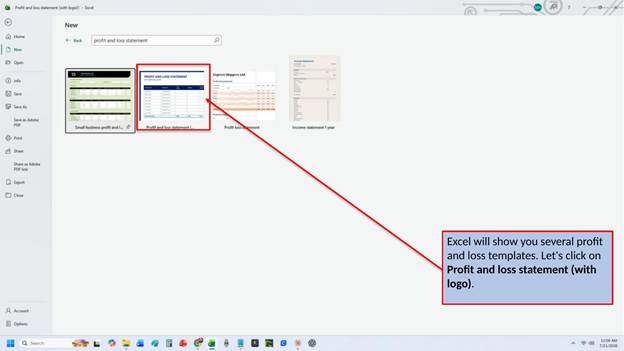
Step 5: Select the Profit and Loss Statement Template
Excel will return several profit and loss templates to choose from. For this walkthrough, we’ll select Profit and loss statement (with logo). Each thumbnail gives you a small preview of the template’s layout, so feel free to click through a few options if you’d like to compare styles before settling on the one that fits your business best.
Step 6: Review and Create
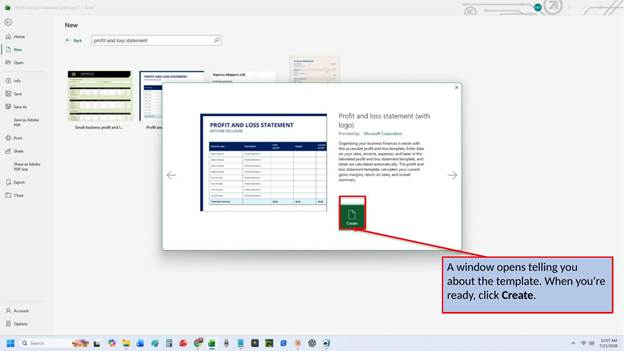
After selecting a template, Excel opens a preview window with a short description of what the template includes. Take a moment to review it, and when you’re ready, click Create.
Step 7: Your New Workbook Opens
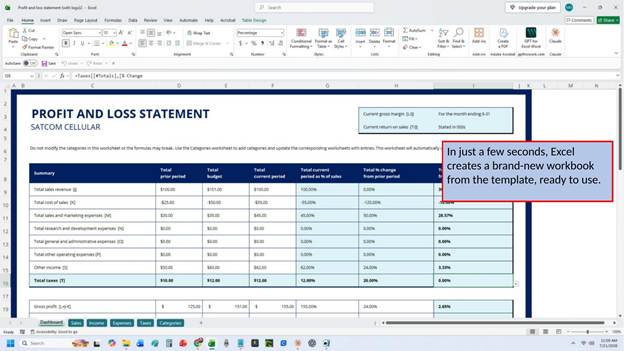
In just a few seconds, Excel builds a brand-new workbook from the template you selected. It’s fully editable and ready for your own business figures right away — no extra setup required.
Getting to Know Your Profit and Loss Statement Tabs
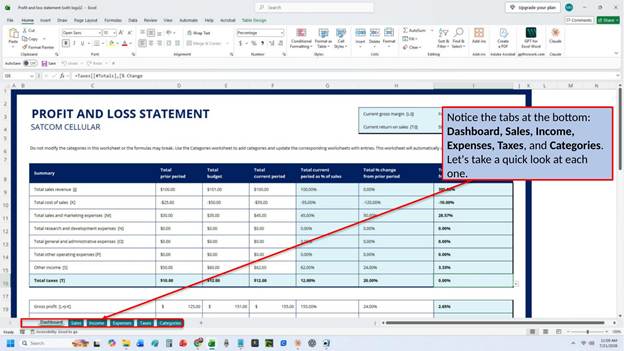
Along the bottom of the workbook, you’ll notice six tabs: Dashboard, Sales, Income, Expenses, Taxes, and Categories. Each one is designed to hold a different piece of your financial picture, so let’s take a quick look at what you’ll find on each.
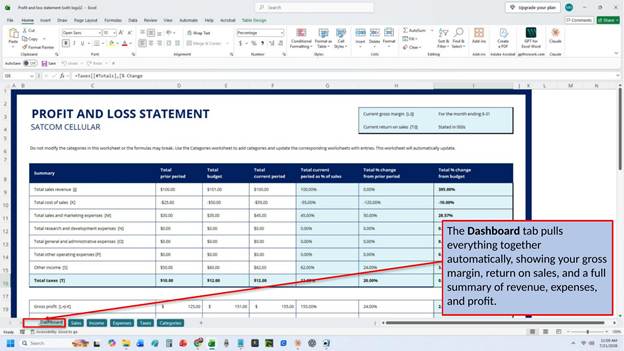
The Dashboard Tab
The Dashboard tab pulls everything together automatically, calculating your gross margin and return on sales, and rolling up your total revenue, expenses, and profit into one easy-to-read summary. Since it’s built entirely from formulas, you won’t need to update it yourself — it refreshes as soon as you fill in the other tabs.
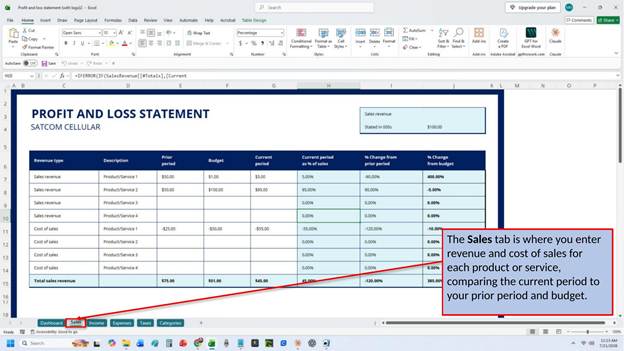
The Sales Tab
The Sales tab is where you’ll enter revenue and cost of sales for each of your products or services. It’s set up to compare your current period against both your prior period and your budget, so you can quickly see whether sales are trending up or down.
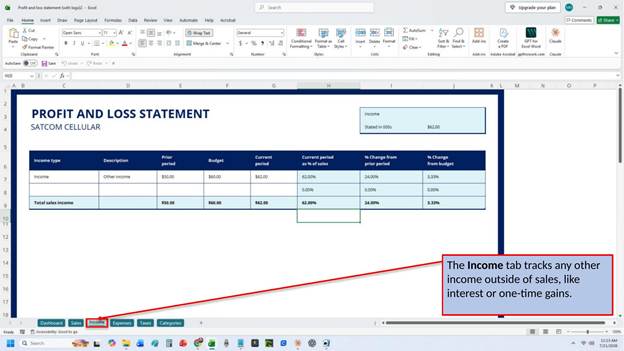
The Income Tab
The Income tab tracks any money coming in from outside your regular sales, such as interest earned or one-time gains. Keeping this separate from your sales figures gives you a clearer picture of how your core business is actually performing.
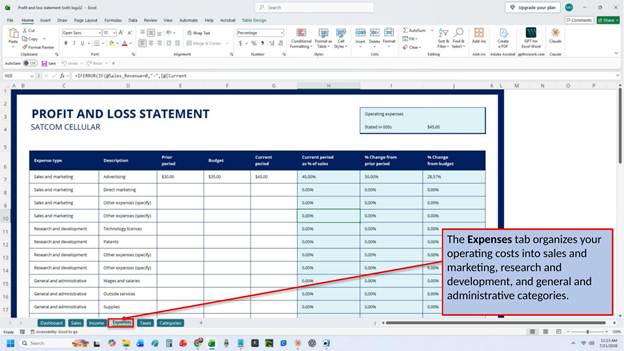
The Expenses Tab
The Expenses tab organizes your operating costs into three categories: sales and marketing, research and development, and general and administrative expenses. Breaking expenses out this way makes it easier to spot where your money is actually going.
The Taxes Tab
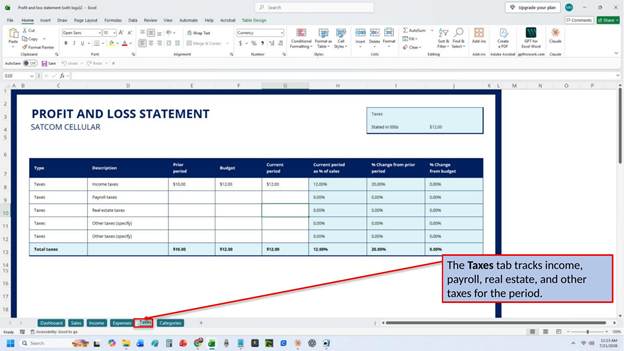
The Taxes tab keeps a record of income, payroll, real estate, and any other taxes owed for the period, so they’re accounted for separately from your day-to-day operating expenses.
The Categories Tab
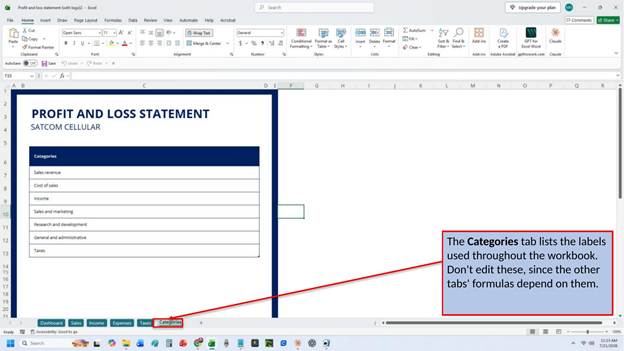
The Categories tab lists the labels used throughout the rest of the workbook. It’s best to leave these as they are, since the formulas on the other tabs are built to reference them directly, and changing a label here could break those calculations.
With just a few clicks, you now have a fully organized workbook ready to help you track your business’s profit and loss from start to finish. Simply replace the sample figures on each tab with your own numbers, and you’ll have a clear, automatically updating summary of how your business is performing. The next time you need to review your finances, give Excel’s built-in Profit and Loss Statement template a try and see how much easier it makes staying on top of the numbers.
Video Tutorial
Download PDF Below