
Last updated: July 18, 2026
Quick Answer: Excel can function as a lightweight database when you combine its built-in database functions (DSUM, DGET, DAVERAGE), modern lookup formulas (INDEX/MATCH, XLOOKUP), and dynamic array tools (FILTER, UNIQUE, SORT). These spreadsheet formulas for advanced users give you structured querying, multi-table joins, and automated data retrieval, without writing a single line of SQL. The approach works well for datasets under roughly 100,000 rows; beyond that, a dedicated database tool is worth considering.
Key Takeaways
- INDEX/MATCH beats VLOOKUP for flexible, two-way lookups and is faster on large datasets.
- Excel’s D-functions (DSUM, DAVERAGE, DGET, DMAX, DMIN) let you query data with criteria ranges, similar to a WHERE clause in SQL. [1][2]
- Dynamic array formulas (FILTER, UNIQUE, SORT, SEQUENCE) replace complex helper-column setups and return results that spill automatically.
- LAMBDA and LET let you build reusable, named functions inside a workbook, a major step toward modular formula design.
- Power Query is the right tool for heavy data transformation; advanced formulas handle on-the-fly querying.
- Excel starts to struggle with performance above ~100,000 rows or when many volatile formulas (INDIRECT, OFFSET) are stacked.
- Structured Table references (like
Table1[Sales]) make formulas self-updating and far easier to read than cell ranges. - Proper data validation and error handling (IFERROR, IFNA, data drop-downs) are what separate a fragile spreadsheet from a reliable one.
- Knowing when to leave Excel for a real database is just as important as knowing how to push Excel to its limits.
What Are the Best Excel Formulas for Managing Large Datasets?
The highest-impact formulas for large datasets are INDEX/MATCH, XLOOKUP, SUMIFS/COUNTIFS/AVERAGEIFS, the D-functions, and the dynamic array family (FILTER, UNIQUE, SORT). Together, these cover the core database operations: lookup, aggregation, filtering, and deduplication. [3][5]
Top formulas by use case:
| Use Case | Best Formula(s) |
|---|---|
| Flexible lookup | INDEX/MATCH, XLOOKUP |
| Conditional totals | SUMIFS, AVERAGEIFS, DSUM |
| Filter rows by criteria | FILTER, DGET |
| Remove duplicates | UNIQUE |
| Sort results dynamically | SORT, SORTBY |
| Count distinct values | SUMPRODUCT + 1/COUNTIF |
| Named reusable logic | LET, LAMBDA |
Common mistake: Using VLOOKUP on a table where the lookup column isn’t the leftmost column. Switch to XLOOKUP or INDEX/MATCH instead, both work in any direction.
How to Use VLOOKUP and INDEX/MATCH to Query Data Like a Database
INDEX/MATCH is the more flexible choice for database-style queries. VLOOKUP locks you into searching only the leftmost column and breaks if columns are reordered. INDEX/MATCH searches any column and returns a value from any other column in the same row. [3]
Basic INDEX/MATCH syntax:
<code>=INDEX(ReturnColumn, MATCH(LookupValue, SearchColumn, 0))
</code>
Example: Pull a product price from a separate table:
<code>=INDEX(Products[Price], MATCH(A2, Products[ProductID], 0))
</code>
XLOOKUP (available in Excel 365 and Excel 2021+) simplifies this further:
<code>=XLOOKUP(A2, Products[ProductID], Products[Price], "Not Found")
</code>
Choose INDEX/MATCH if you need backward lookups, approximate matches in unsorted data, or compatibility with older Excel versions. Choose XLOOKUP if you’re on a modern version and want cleaner syntax with a built-in “not found” fallback.
Can Excel Replace a Real Database for Small Business Data Management?
Excel works well as a lightweight database for small businesses managing up to roughly 50,000-100,000 rows of structured data, a handful of related tables, and a small number of concurrent users (ideally one at a time). It falls short when you need multi-user simultaneous editing, enforced referential integrity, or complex transaction logging.
Excel is a solid fit when:
- Data volume is modest and grows slowly.
- One or two people maintain the file.
- Reporting needs are met by PivotTables and formula-based dashboards.
- Budget doesn’t support database software licensing.
Excel is not the right fit when:
- Multiple users edit the same records at the same time.
- Data relationships are complex (many-to-many joins).
- Audit trails and rollback are required.
- The dataset exceeds a few hundred thousand rows.
For building reusable calculation blocks that scale with your data, see this guide on spreadsheet equations for real analytics.
What’s the Difference Between Pivot Tables and Database Queries in Excel?
PivotTables summarize and group data interactively; database-style queries (using D-functions or FILTER) return specific records or calculated values based on criteria. PivotTables are better for exploratory analysis; formula-based queries are better when you need a live, formula-driven result embedded in another calculation.
PivotTable strengths:
- Drag-and-drop grouping and aggregation.
- Built-in drill-down.
- Fast for ad-hoc analysis.
Formula query strengths:
- Results update automatically when source data changes.
- Can feed into other formulas downstream.
- More precise control over criteria.
Edge case: GETPIVOTDATA can pull specific values out of a PivotTable into a formula, bridging the two approaches.
How to Set Up Excel with Relational Data Structures
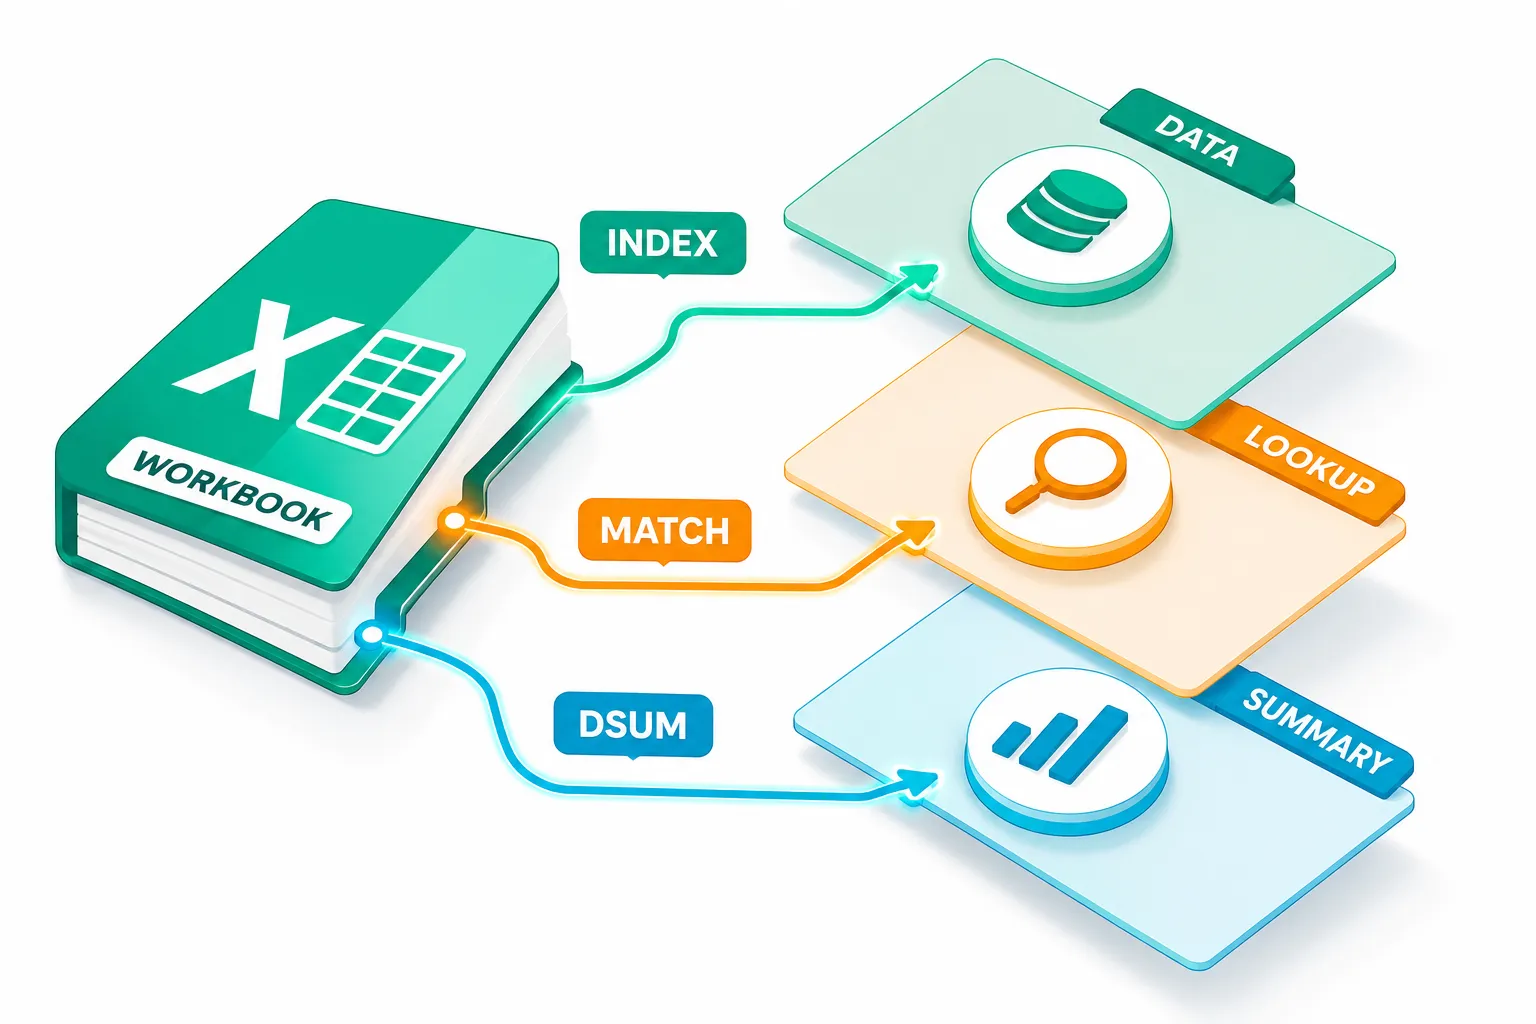
Excel supports relational data through the Data Model (Power Pivot), structured Tables, and manual lookup-based joins. The most practical approach for advanced users without Power Pivot is to store each entity in its own named Table and link them with XLOOKUP or INDEX/MATCH. [4]
Step-by-step setup:
- Convert each data range to a Table (Ctrl+T). Name each Table clearly:
Orders,Customers,Products. - Use structured references in formulas:
=XLOOKUP([@CustomerID], Customers[CustomerID], Customers[Name]). - Add a drop-down list in key columns to enforce consistent IDs. See how to add a drop-down list in Excel for a step-by-step walkthrough.
- Lock header rows and protect formula columns to prevent accidental overwrites. The guide on how to lock specific cells in Excel covers this clearly.
- Use the Data Model (Insert > PivotTable > Add to Data Model) if you need true relational joins across large tables.
Structured Table references auto-expand when new rows are added, which eliminates the need to update formula ranges manually.
What Formulas Help with Data Validation and Error Handling in Spreadsheets?
IFERROR, IFNA, and IFS are the core error-handling formulas. Combined with data validation drop-downs and ISBLANK/ISNUMBER checks, they prevent bad data from breaking downstream calculations. [5]
Key error-handling patterns:
=IFERROR(XLOOKUP(...),"Not Found"), catches any error and replaces it with a readable label.=IFNA(MATCH(...),-1), specifically catches #N/A, useful when “no match” is a valid outcome.=IF(ISNUMBER(A2), A2*B2, "Check input"), validates input type before calculating.=LET(result, XLOOKUP(...), IF(ISNA(result),"Missing",result)), uses LET to avoid repeating the lookup formula twice.
Common mistake: Wrapping an entire complex formula in IFERROR without knowing which part fails. Use LET to name intermediate results and test each step separately.
To find duplicates in Excel before they cause data integrity issues, use COUNTIF-based conditional formatting as an early-warning layer.
What Are Array Formulas and When Should You Use Them for Data Analysis?
Array formulas process multiple values in a single formula step, returning either a single result or a spilled range of results. In Excel 365, most array behavior is automatic, you no longer need Ctrl+Shift+Enter for most tasks. [5]
When to use array formulas:
- Counting rows that meet multiple criteria without a helper column.
- Returning a filtered list of records dynamically.
- Performing matrix calculations (MMULT for weighted scoring models).
Practical examples:
<code class="language-excel">// Count orders over $500 in the East region
=SUMPRODUCT((Orders[Region]="East")*(Orders[Amount]>500))

// Return all matching rows (Excel 365)
=FILTER(Orders, (Orders[Region]="East")*(Orders[Amount]>500))

// Unique list of product categories
=UNIQUE(Products[Category])
</code>
Edge case: Legacy array formulas entered with Ctrl+Shift+Enter can slow down large workbooks significantly. Replace them with dynamic array equivalents (FILTER, UNIQUE, SORT) wherever possible.
How to Automate Data Entry and Updates Across Multiple Excel Sheets
The most reliable approach is to store all data in one master Table and pull values into other sheets with formulas, rather than duplicating data across sheets. This keeps a single source of truth and eliminates sync errors.
Practical techniques:
- Named ranges and structured references work across sheets:
=SUM(MasterData[Q1_Sales])from any sheet. - INDIRECT can reference sheet names dynamically, but use it sparingly, it’s a volatile function that recalculates on every change.
- XLOOKUP across sheets:
=XLOOKUP(A2, Sheet2!A:A, Sheet2!B:B) - LET and LAMBDA let you define a lookup logic once and reuse it across sheets without rewriting the formula.
For a deeper look at building calculation blocks that work across sheets, the guide on spreadsheet equations for real analytics is a practical next read.
Can Excel Formulas Join Data from Different Tables?
Yes, Excel formulas can simulate SQL-style joins using XLOOKUP, INDEX/MATCH, and the FILTER function. A left join (return all rows from one table, matched data from another) is straightforward with XLOOKUP. Inner joins (only matching rows) require FILTER combined with MATCH or COUNTIF. [3][4]
Left join example:
<code class="language-excel">// Add customer name to every order row
=XLOOKUP([@CustomerID], Customers[CustomerID], Customers[FullName], "Unknown")
</code>
Inner join simulation (returns only matched rows):
<code class="language-excel">=FILTER(Orders, ISNUMBER(MATCH(Orders[CustomerID], Customers[CustomerID], 0)))
</code>
Limitation: These formula-based joins recalculate on every change. For large tables (tens of thousands of rows), Power Query handles joins far more efficiently and doesn’t slow the workbook.
How Do Power Query and Advanced Formulas Compare for Data Transformation?
Power Query is better for importing, cleaning, and reshaping data before analysis. Advanced formulas are better for live, in-cell querying and calculations after the data is loaded. They solve different problems and work best together. [5]
Use Power Query when:
- Data comes from external sources (CSV, web, SQL, APIs).
- You need to unpivot, merge, or reshape tables.
- Transformation steps need to be repeatable and auditable.
Use advanced formulas when:
- You need results that update as users type or select values.
- Calculations depend on other formula outputs.
- The dataset is already clean and loaded.
The best setup: Use Power Query to load and clean data into a structured Table, then use XLOOKUP, FILTER, SUMIFS, and D-functions to query that Table dynamically.

Is It Faster to Use Excel or Actual Database Software for Data Lookups?
For datasets under ~50,000 rows, Excel formula lookups are fast enough for most business use. Above that threshold, or when many XLOOKUP/FILTER formulas run simultaneously, calculation time increases noticeably. A dedicated database (SQLite, Access, PostgreSQL) handles millions of rows with indexed lookups that are orders of magnitude faster.
Performance benchmarks (general estimates):
- XLOOKUP on 10,000 rows: near-instant.
- FILTER on 100,000 rows with multiple criteria: 1-5 seconds on average hardware.
- SQL indexed query on 1,000,000 rows: typically under 1 second.
These are rough estimates based on typical hardware; actual performance varies by formula complexity and machine specs.
What Performance Issues Should You Watch for with Large Excel Databases?
The biggest performance killers in large Excel workbooks are volatile functions, excessive cross-sheet references, and unindexed lookups scanning full columns. [5]
Watch out for:
- 🔴 INDIRECT and OFFSET, recalculate on every keystroke; replace with structured Table references.
- 🔴 Full-column references like
A:Ain SUMIFS, limit to the actual data range or use Table references. - 🟡 Too many XLOOKUP calls on the same large table, consolidate with a single FILTER and reference the result.
- 🟡 Conditional formatting on large ranges, can slow rendering significantly. See how to remove conditional formatting in Excel if your workbook feels sluggish.
- 🟢 Manual calculation mode (Formulas > Calculation Options > Manual), useful while building complex models; press F9 to recalculate when ready.
When Should You Stop Using Excel and Switch to a Real Database?
Switch to a real database when any of these conditions apply: multiple users need to edit data simultaneously, the dataset exceeds 500,000 rows, data integrity rules must be enforced automatically, or audit trails are required for compliance.
Clear signals it’s time to move on:
- The Excel file takes more than 30 seconds to open or save.
- Two people have overwritten each other’s work.
- You’re using INDIRECT to link 10+ sheets together.
- A formula error caused a business decision to go wrong.
Lightweight alternatives to consider:
- SQLite, free, file-based, works with Python and many tools.
- Microsoft Access, integrates with Excel, good for small teams.
- Airtable or Notion, no-code relational databases with spreadsheet-like interfaces.
- PostgreSQL / MySQL, full relational databases for growing data needs.
FAQ
Q: What’s the difference between DSUM and SUMIFS? DSUM uses a criteria range (a small table with headers and conditions), which makes it easier to set up complex OR conditions. SUMIFS uses inline criteria arguments and is faster for simple AND conditions. For multi-condition OR logic, DSUM or SUMPRODUCT is cleaner. [1][7]
Q: Do array formulas slow down Excel? Legacy Ctrl+Shift+Enter array formulas can slow large workbooks. Dynamic array formulas (FILTER, UNIQUE, SORT) in Excel 365 are optimized and generally faster. Avoid stacking many large array formulas on the same sheet.
Q: What is LAMBDA and why does it matter? LAMBDA lets you define a custom, reusable function using Excel formula syntax, no VBA required. Once defined in the Name Manager, it works like a built-in function anywhere in the workbook. It’s ideal for wrapping complex logic you use repeatedly.
Q: Can I use XLOOKUP to return multiple columns at once?
Yes. Set the return array to span multiple columns: =XLOOKUP(A2, Table[ID], Table[[Name]:[Price]]). The result spills across adjacent cells automatically in Excel 365.
Q: What’s a structured reference and why use it?
A structured reference like Table1[Sales] refers to a column in a named Table. It auto-expands when rows are added, is easier to read than $B$2:$B$500, and works correctly across sheets.
Q: How do I do a case-sensitive lookup in Excel?
Use =INDEX(Range, MATCH(TRUE, EXACT(LookupValue, SearchRange), 0)) entered as a dynamic array formula. EXACT is case-sensitive; MATCH is not.
Q: Is GETPIVOTDATA useful or annoying? Both. It’s useful for pulling specific PivotTable values into a dashboard formula. It’s annoying when it auto-inserts while you’re building a formula. Turn it off via PivotTable Analyze > Options > uncheck “Generate GetPivotData.”
Q: What’s the best way to handle #N/A errors in lookup formulas?
Use IFNA() rather than IFERROR() when you only want to catch missing matches. IFERROR catches all errors, which can hide real formula mistakes.
Q: Can Excel’s D-functions handle OR conditions? Yes. In the criteria range, place conditions on separate rows. DSUM and DAVERAGE treat rows as OR conditions and columns as AND conditions. [4][7]
Q: How do I calculate totals across related tables in Excel?
Use SUMIF or SUMIFS with a lookup column as the criteria range. For example: =SUMIFS(Orders[Amount], Orders[CustomerID], [@CustomerID]) sums all orders for a given customer ID. For more on total calculations, see how to calculate total cost in Excel.
Conclusion
Mastering spreadsheet formulas for advanced users, the high-impact techniques that make Excel work like a lightweight database, comes down to a few core habits: store data in named Tables, use INDEX/MATCH or XLOOKUP for lookups, lean on D-functions for criteria-based aggregation, and replace legacy array formulas with dynamic array equivalents wherever possible.
Actionable next steps:
- Audit your current workbook. Replace any VLOOKUP with XLOOKUP or INDEX/MATCH, and convert raw ranges to named Tables.
- Add one D-function. Swap a complex SUMIFS with a DSUM using a criteria range and see how much easier it is to add new conditions.
- Try LET on your most complex formula. Break it into named steps, it will be easier to debug and maintain.
- Test Power Query for any data you’re importing manually. Set it up once and refresh with a click.
- Set a row-count threshold. Decide now at what point you’ll move to a real database, 100,000 rows is a reasonable starting point for most small business use cases.
For more on building solid Excel foundations, explore the guide on Excel text functions for extracting and cleaning data and the overview of how to find duplicates in Excel to keep your data clean before querying it.
References
[1] Excel Database Functions – https://www.xlsoffice.com/excel-functions/excel-database-functions/?utm_source=openai
[2] Database Functions Reference – https://support.microsoft.com/en-US/Excel/database-functions-reference?utm_source=openai
[3] 18 Advanced Excel Formulas To Analyze Data Accurately – https://excel-formula.com/18-advanced-excel-formulas-to-analyze-data-accurately.html?utm_source=openai
[4] Excel Database Functions – https://www.exceldemy.com/excel-database-functions/?utm_source=openai
[5] Mastering Excel Formulas From Basics To Advanced Techniques – https://www.excelhelp.com/mastering-excel-formulas-from-basics-to-advanced-techniques/?utm_source=openai
[7] Excel’s Database Functions – https://www.dummies.com/article/technology/software/microsoft-products/excel/excels-database-functions-255631?utm_source=openai
[10] Excel Functions Alphabetical – https://support.microsoft.com/en-US/Excel/excel-functions-alphabetical?utm_source=openai