Over 750 million people use Microsoft Excel worldwide — yet studies show most users tap into fewer than 10% of its features. Learning how to use Excel properly can save hours every week, reduce errors, and turn raw data into clear, actionable insights. Whether tracking a budget, managing a project, or analyzing thousands of rows of data, Excel remains the gold standard spreadsheet tool in 2026.
Key Takeaways
- Excel’s interface is built around cells, rows, columns, and the ribbon — mastering these basics unlocks everything else.
- Formulas and functions like SUM, AVERAGE, and IF are the engine of any spreadsheet.
- Charts, PivotTables, and conditional formatting transform data into visual stories.
- New features in Excel 2024 and beyond — including LAMBDA, dynamic arrays, and Copilot AI — make advanced tasks far more accessible. [1][2]
- Using templates is the fastest way to get productive immediately.
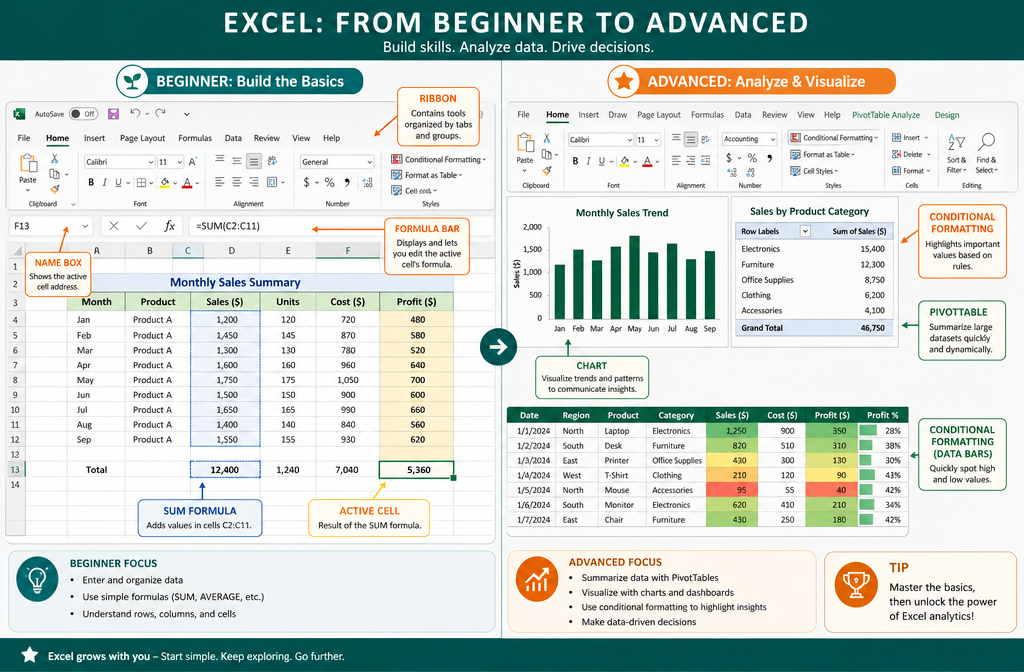
Understanding the Excel Interface
Before diving into formulas and charts, it helps to know the layout. Excel’s workspace has a few key areas:
| Area | What It Does |
|---|---|
| Ribbon | Toolbar at the top with tabs like Home, Insert, Formulas, Data |
| Name Box | Shows the address of the selected cell (e.g., A1) |
| Formula Bar | Displays and edits the content of the active cell |
| Worksheet Tabs | Lets you switch between sheets in the same workbook |
| Cells/Grid | The main workspace — columns labeled A–Z, rows numbered 1 onward |
💡 Pro tip: Press Ctrl + Home to jump back to cell A1 instantly from anywhere in a large spreadsheet.
When first learning how to use Excel, spend a few minutes clicking each ribbon tab. The Home tab handles formatting. Insert adds charts and tables. Formulas gives access to every built-in function. Data manages sorting, filtering, and connections.
How to Use Excel Formulas and Functions
Formulas are what make Excel powerful. Every formula starts with an equals sign (=). From there, you can do simple math or build complex logic.
Essential Formulas to Know First
=SUM(A1:A10)— Adds all values from A1 to A10=AVERAGE(B1:B10)— Calculates the mean=IF(C1>100,"Yes","No")— Returns “Yes” or “No” based on a condition=VLOOKUP(value, table, column, FALSE)— Looks up a value in a table=COUNTIF(D1:D20,"Apples")— Counts cells that match a condition
Excel 2024 also introduced 14 new text and array functions that simplify tasks that previously required complex workarounds. [1] The LAMBDA function is especially exciting — it lets users create custom, reusable formulas without writing VBA code. [1]
Need to clean up decimal places? Check out this guide on how to round numbers in Excel for a step-by-step walkthrough.
Absolute vs. Relative References
This trips up almost every beginner:
- Relative reference (
A1) — Changes when you copy the formula to another cell. - Absolute reference (
$A$1) — Stays locked no matter where you paste it.
Press F4 while clicking a cell reference in the formula bar to toggle between reference types.
How to Use Excel for Data Organization
Good data organization is the foundation of any useful spreadsheet. Here are the core habits to build:
Formatting and Layout Tips 🗂️
- Keep one type of data per column — Don’t mix names and dates in the same column.
- Use headers in Row 1 — Bold them and freeze the top row so they stay visible while scrolling. Learn how with this guide on freezing the top row and first column.
- Expand columns to fit content — Double-click the column border or use the expand all columns at once trick.
- Apply conditional formatting — Highlight cells automatically based on their value. For example, use traffic light conditional formatting to make performance data instantly readable.
- Lock important cells — Prevent accidental edits with a step-by-step guide to locking cells in Excel.
Sorting and Filtering
- Sort data by selecting any cell in a column, then going to Data → Sort A to Z (or Z to A).
- Filter data with Data → Filter — small dropdown arrows appear in each header, letting you show only the rows that match specific criteria.
💬 “Filtered data doesn’t disappear — it just hides. Use Ctrl + Shift + L to toggle filters on and off quickly.”
Visualizing Data: Charts and Graphs
Numbers in a grid are hard to interpret at a glance. Charts fix that. Excel makes it easy to turn Excel data into a graph in just a few clicks:
- Select the data you want to chart (including headers).
- Go to Insert → Charts and pick a chart type.
- Use the Chart Design tab to customize colors, labels, and layout.
Common Chart Types and When to Use Them
| Chart Type | Best For |
|---|---|
| Bar / Column | Comparing categories side by side |
| Line | Showing trends over time |
| Pie | Displaying parts of a whole (use sparingly) |
| Scatter | Showing relationships between two variables |
| PivotChart | Summarizing large, unsorted datasets |
Excel 2024 introduced dynamic charts that automatically update when the underlying dynamic array data changes — no manual refresh needed. [1]
PivotTables: Excel’s Most Powerful Feature
PivotTables sound intimidating but are genuinely one of the fastest ways to summarize large datasets. Here’s the quick version:
- Click anywhere inside your data table.
- Go to Insert → PivotTable.
- Drag fields into the Rows, Columns, and Values boxes.
- Excel instantly summarizes the data.
Example: A sales spreadsheet with 5,000 rows can be summarized by region, product, and month in under 30 seconds using a PivotTable.
In 2026, Excel also features PivotTable auto-refresh, so connected data sources stay current without manual intervention. [3]
Using Excel Templates to Save Time ⚡
Starting from a blank sheet every time is inefficient. Excel has hundreds of built-in templates, and there are many free options online. Here are some practical starting points:
- 📊 Budget tracking: Use a ready-to-use college budget template for Excel 365 to manage income and expenses.
- 💳 Debt payoff: The Excel credit card payoff calculator template shows exactly how long it takes to clear a balance.
- 📅 Project management: A project timeline template for Excel keeps tasks and deadlines organized visually.
Templates eliminate setup time and provide a professional structure to build on.
New Excel Features Worth Knowing in 2026
Excel keeps evolving. Here are the standout additions that make learning how to use Excel even more rewarding today:
🤖 Copilot AI Integration
Microsoft 365 Copilot in Excel lets users describe what they want in plain English — “show me which products had the highest sales last quarter” — and the AI generates the analysis, formula, or chart automatically. [2]
🖼️ IMAGE Function
The =IMAGE() function inserts images directly into cells, making product catalogs and visual dashboards much easier to build. [1]
🔒 Improved Security
Excel now blocks XLL add-ins from the internet by default, reducing the risk of malware sneaking in through third-party add-ins. [1]
📂 Better Format Support
Support for ODF 1.4 means Excel plays nicer with open-source tools like LibreOffice, which matters for teams using mixed software environments. [1]
Conclusion: Your Next Steps with Excel
Learning how to use Excel is one of the highest-return skills anyone can develop in 2026. Start with the basics — entering data, writing a SUM formula, and creating a simple chart. Then layer in PivotTables, conditional formatting, and keyboard shortcuts as confidence grows.
Actionable next steps:
- ✅ Open Excel and create a simple budget using the college budget template as a starting point.
- ✅ Practice three formulas:
SUM,IF, andVLOOKUP. - ✅ Build one chart from real data — even a simple bar chart counts.
- ✅ Explore conditional formatting to make data visually meaningful.
- ✅ Bookmark the Mark’s Excel Tips AI Search to get instant answers to specific Excel questions as they come up.
Every Excel expert started exactly where beginners start today — one cell at a time. 🚀
References
[1] What’s New in Excel 2024 for Windows and Mac – https://support.microsoft.com/en-us/office/what-s-new-in-excel-2024-for-windows-and-mac-faee26b6-ad74-40a8-9304-aa6db716553f?utm_source=openai
[2] Excel – Microsoft 365 – https://www.microsoft.com/en-us/microsoft-365/excel?msockid=0cf945cb04b063fb3d9c538b05e0629e&utm_source=openai
[3] What’s New in Excel – July 2025 – https://techcommunity.microsoft.com/blog/excelblog/whats-new-in-excel-july-2025/4428623?utm_source=openai