
Hello, and welcome to Mark’s Excel Tips. Today, we are going to show you how to create a Graph from any data in Excel. Let’s get started.
Click here to view our video tutorial.
Click here to download our PDF tutorial.
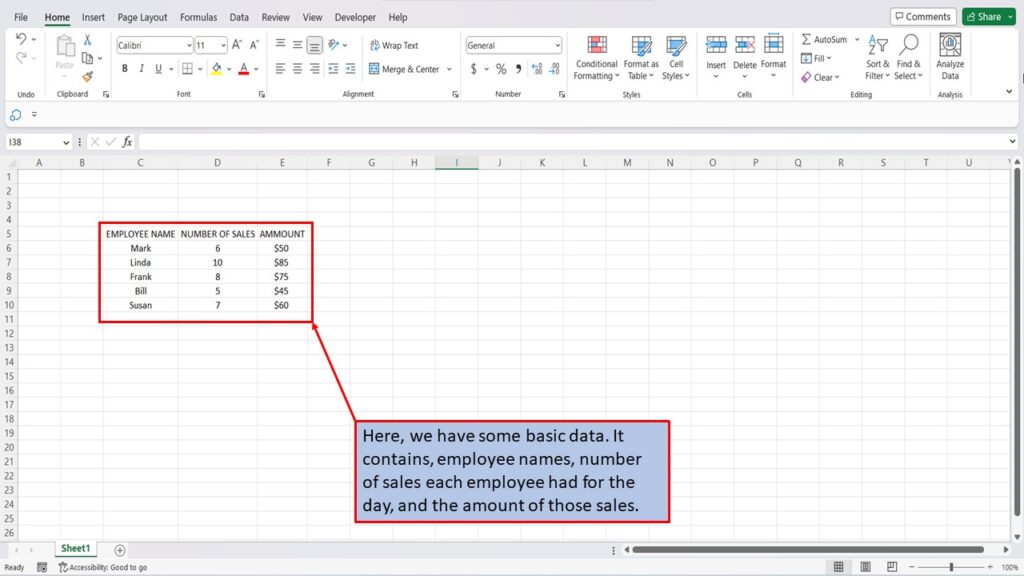
Here, we have some basic data. It contains, employee names, number of sales each employee had for the day, and the amount of those sales.
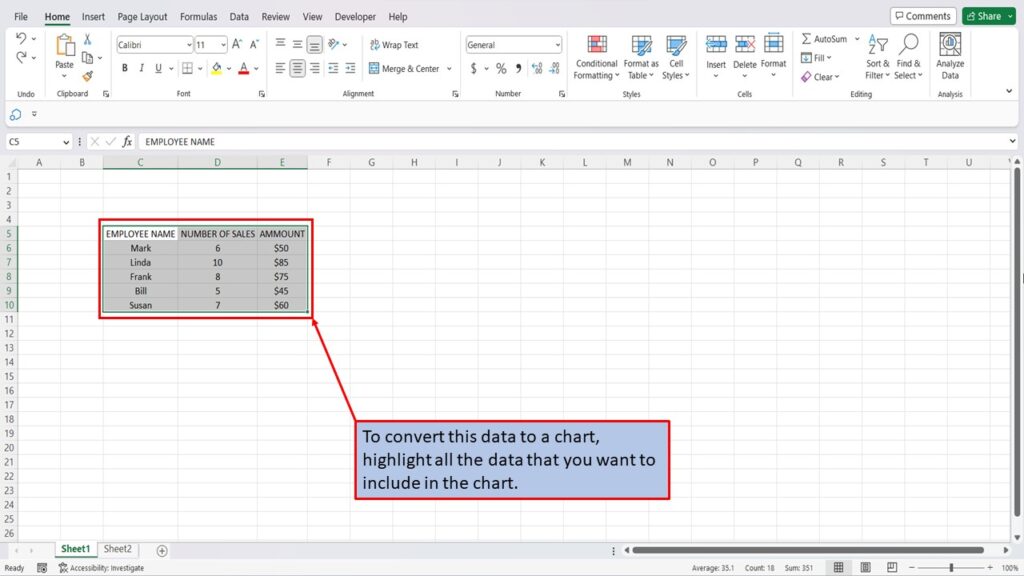
To convert this data to a graph, highlight all the data that you want to include in the graph.
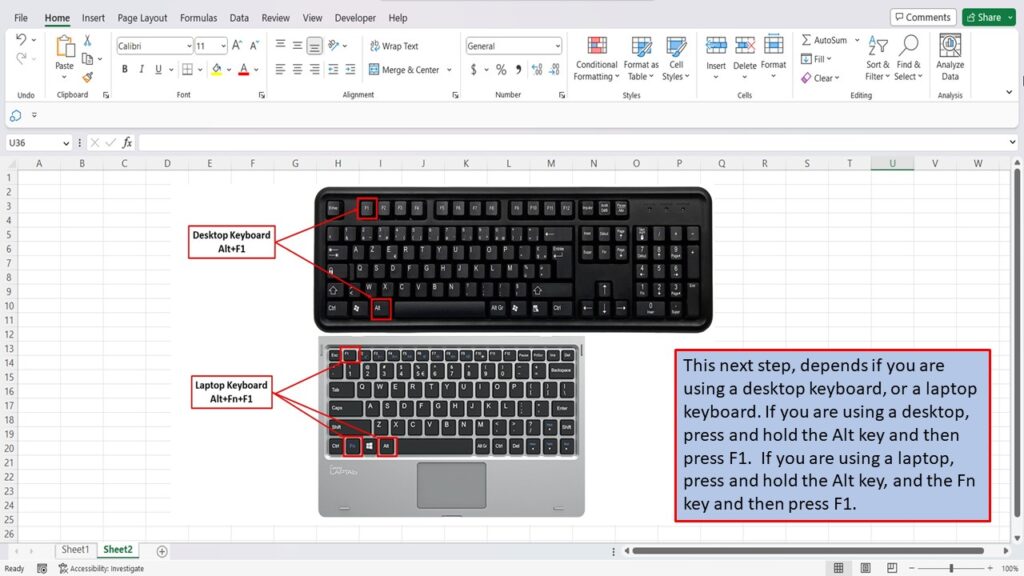
This next step, depends on if you are using a desktop keyboard, or a laptop keyboard. If you are using a desktop keyboard, press and hold the Alt key and then press F1. If you are using a laptop keyboard, press and hold the Alt key, and the Fn key and then press F1.
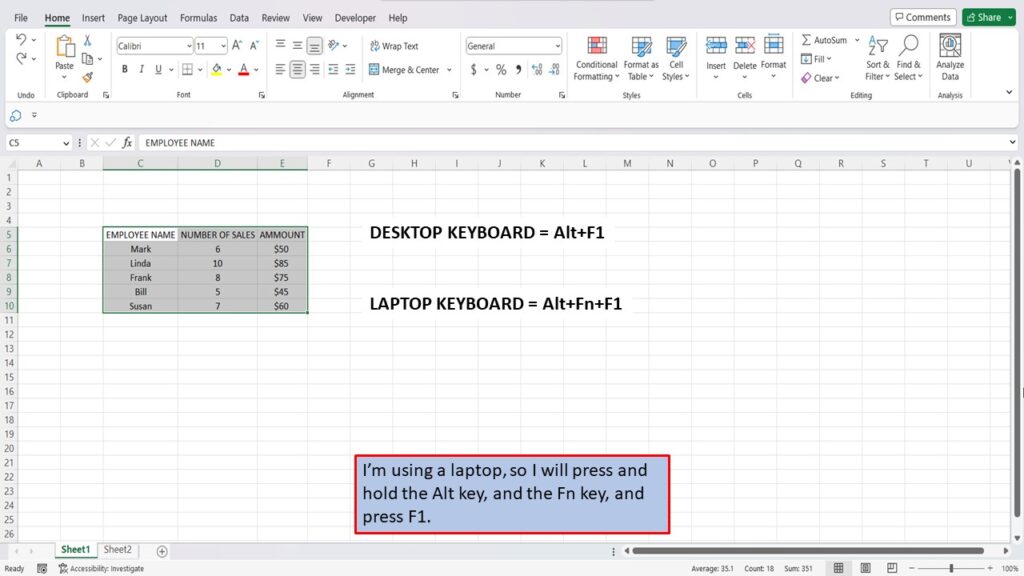
I’m using a laptop, so I will press and hold the Alt key, and the Fn key, and press F1.
Desktop = Alt+F1. Laptop = Alt+Fn+F1.
Excel, will take your data and convert it into a graph.

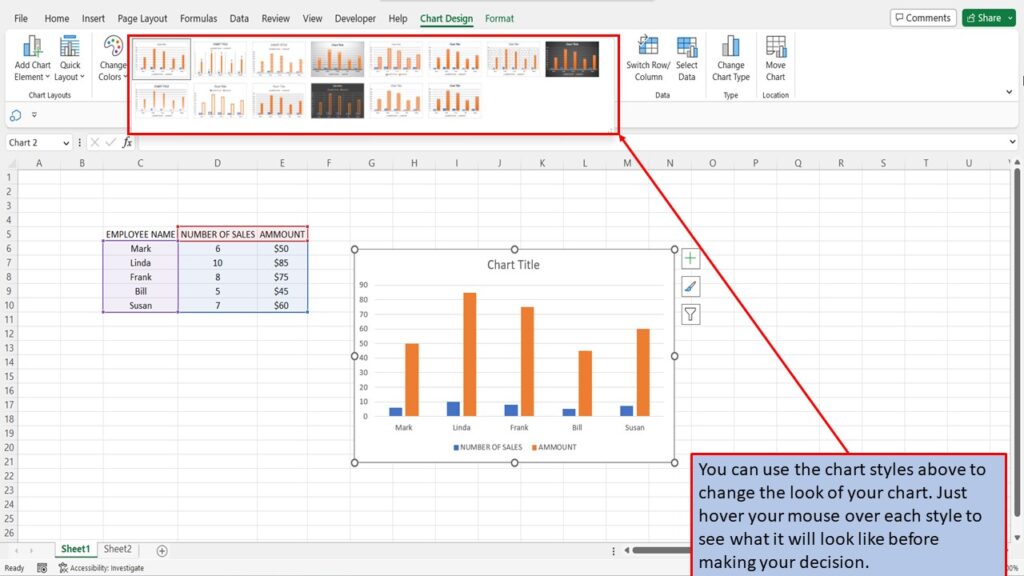
You can use the chart styles above to change the look of your graph. Just hover your mouse over each style to see what it will look like before making your decision.
View the Video Tutorial.
Download this tutorial in PDF by clicking the Download link below.