
Last updated: June 8, 2026
Quick Answer: To use Excel to calculate, click any cell, type =, then enter a formula or function (for example, =SUM(A1:A10)) and press Enter. Excel handles everything from basic arithmetic to complex financial models, statistical tests, and amortization schedules, all without needing a math background.
Key Takeaways
- Every Excel formula starts with
=. Without it, Excel treats your entry as plain text. - The most essential functions for beginners are SUM, AVERAGE, COUNT, IF, and VLOOKUP.
SUMIFadds only the values that meet a condition;SUMadds everything in a range.- Percentage change formula:
=(New Value - Old Value) / Old Value, formatted as a percentage. - Excel can build full loan amortization schedules using the PMT, IPMT, and PPMT functions.
- Most people can learn everyday Excel calculations in a few hours; advanced financial modeling takes weeks of practice.
- Common beginner mistakes include forgetting the
=sign, mixing relative and absolute cell references, and circular references. - Excel handles most business and financial calculations well, but it’s not ideal for real-time data processing or very large datasets (over ~1 million rows).
What Are the Basic Formulas You Need to Know in Excel
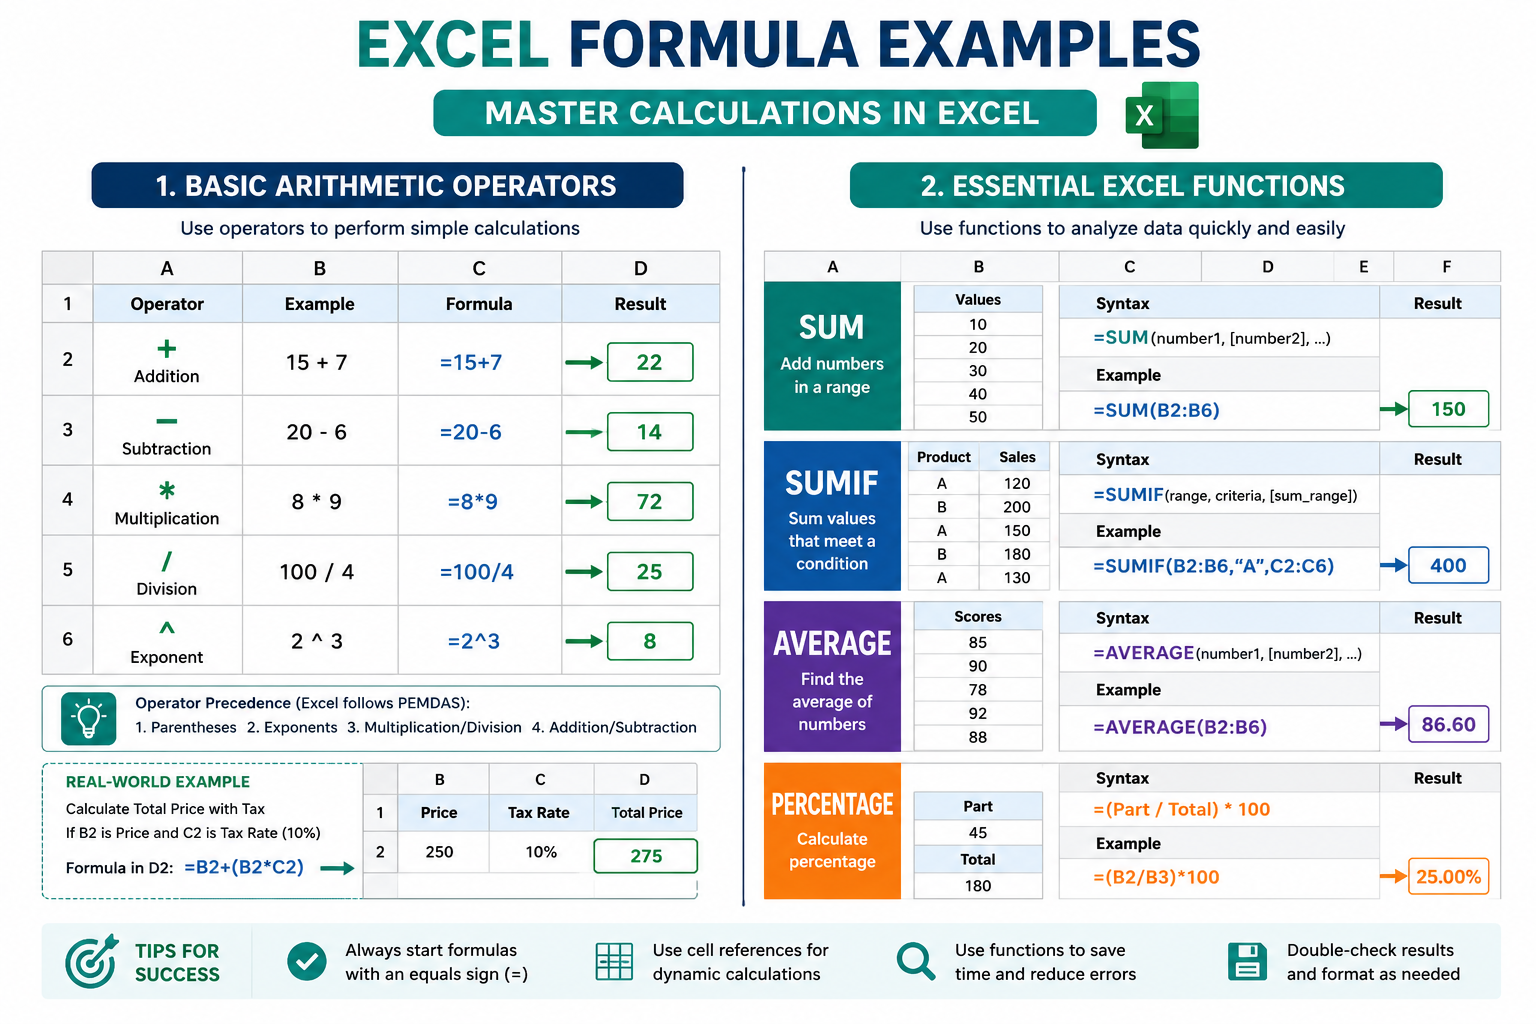
The six formulas that cover 80% of everyday calculation needs in Excel are SUM, AVERAGE, COUNT, IF, VLOOKUP, and basic arithmetic operators. Once these feel natural, everything else builds on them.
Here’s a quick reference:
| Formula | What It Does | Example |
|---|---|---|
=SUM(A1:A10) |
Adds a range of numbers | Total sales for the month |
=AVERAGE(B1:B10) |
Finds the mean of a range | Average test score |
=COUNT(C1:C10) |
Counts cells with numbers | How many entries exist |
=IF(D1>100,"Yes","No") |
Returns one value if true, another if false | Flag high-value orders |
=VLOOKUP(E1,A:B,2,0) |
Looks up a value in a table | Find a product price by ID |
=A1*B1 |
Multiplies two cells | Unit price × quantity |
To create any formula in Excel [5]:
- Click the cell where you want the result.
- Type
=to start the formula. - Enter your function name or operators (e.g.,
SUM,+,-,*,/). - Press Enter to calculate.
💡 Quick tip: In September 2025, Microsoft rolled out AI-powered formula completion in Excel. As you type
=, Excel now suggests and autocompletes formulas in real time, which makes it much easier to discover functions you didn’t know existed. [1]
Also useful: the how to add numbers in rows in Excel with a formula guide covers row-level SUM patterns in detail.
How to Calculate Percentage Changes in a Spreadsheet
Percentage change in Excel uses one formula: =(New - Old) / Old. Format the result cell as a percentage (Ctrl+Shift+%) and Excel displays it correctly.
Step-by-step:
- Put your old value in cell A1 and new value in B1.
- In C1, type:
=(B1-A1)/A1 - Press Enter, then format C1 as Percentage (Home tab → Number group).
Common variations:
- Percent of total:
=A1/SUM($A$1:$A$10)— note the absolute reference with$signs. - Markup percentage:
=(Selling Price - Cost) / Cost - Year-over-year growth: Same formula, just applied across annual figures.
Common mistake: Dividing by the new value instead of the old. Always divide by the starting (old) number for a true percentage change.
What Is the Difference Between SUM and SUMIF in Excel
SUM adds every number in a range. SUMIF adds only the numbers where a condition is true. Use SUMIF when your data has categories and you only want a subtotal for one of them.
Example:
=SUM(B2:B20)— adds all values in column B.=SUMIF(A2:A20,"North",B2:B20)— adds values in column B only where column A says “North.”
For multiple conditions, use SUMIFS:
=SUMIFS(B2:B20, A2:A20, "North", C2:C20, "Q1")
Choose SUMIF if: You have a list with mixed categories and need a breakdown by category (sales by region, expenses by department, etc.).
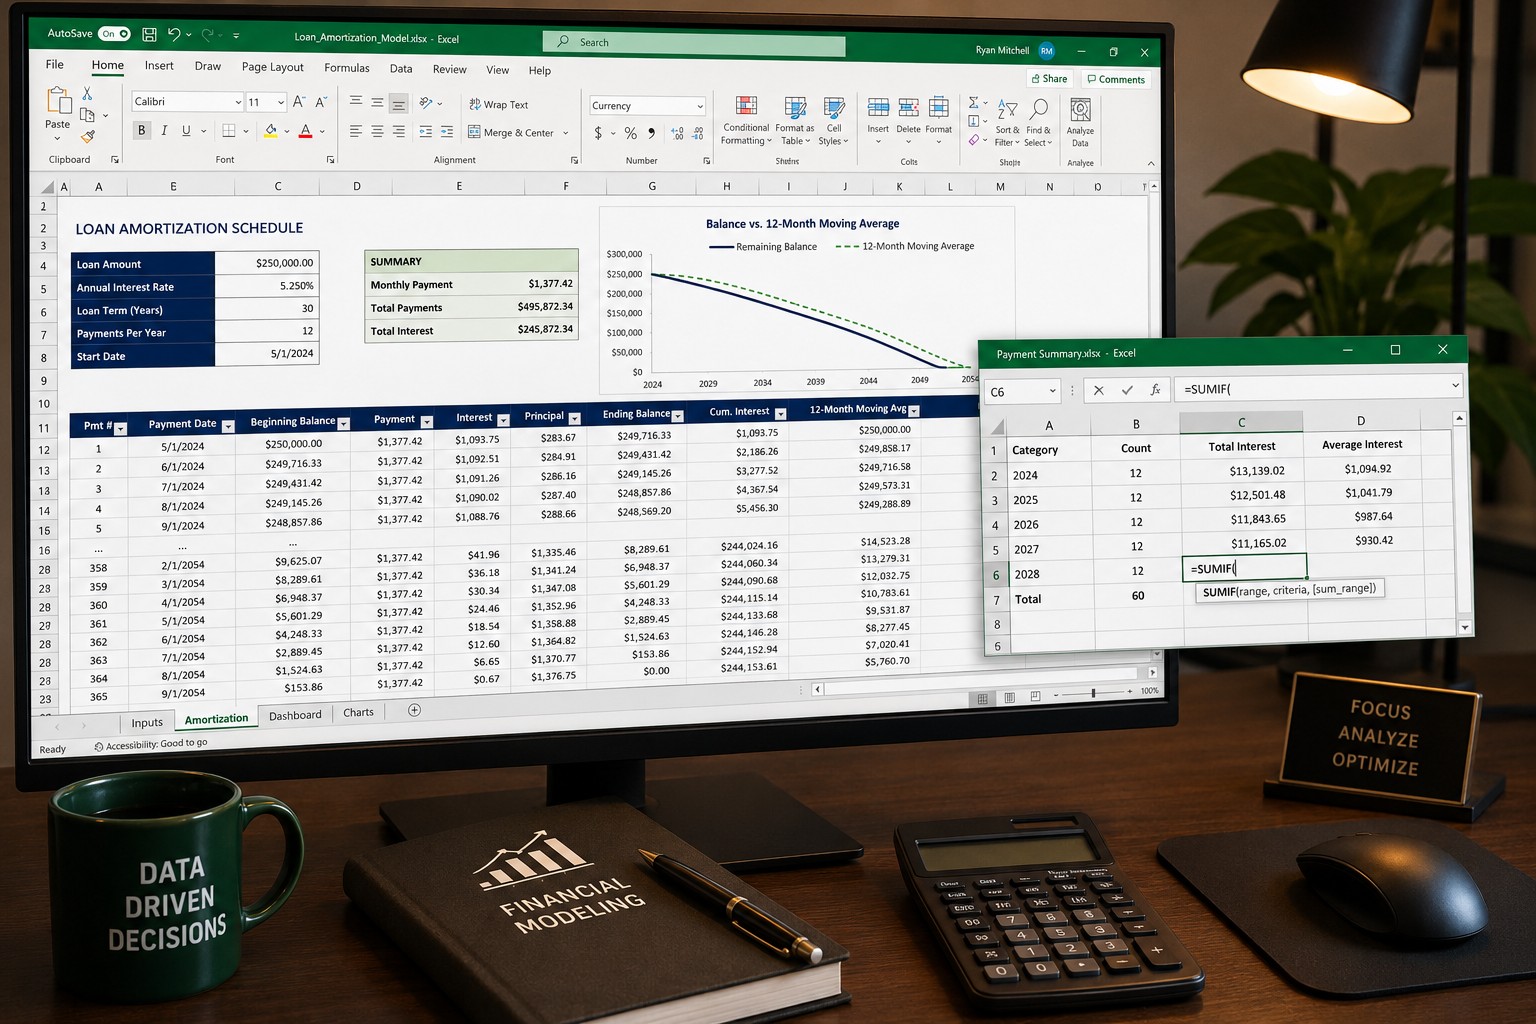
How to Use Excel to Calculate Loan Amortization Schedules
Yes, Excel can build a complete loan amortization schedule. The key functions are PMT (total payment), IPMT (interest portion), and PPMT (principal portion).
Basic setup for a $10,000 loan at 6% annual interest over 36 months:
| Cell | Formula | What It Calculates |
|---|---|---|
| B5 | =PMT(6%/12, 36, -10000) |
Monthly payment |
| C5 | =IPMT(6%/12, 1, 36, -10000) |
Interest in month 1 |
| D5 | =PPMT(6%/12, 1, 36, -10000) |
Principal in month 1 |
Drag these formulas down 36 rows, incrementing the period number, and you have a full schedule showing exactly how much of each payment goes to interest versus principal.
For a ready-to-use approach, the credit card payoff schedule in Excel resource walks through a similar setup for revolving debt.
How Hard Is It to Learn Excel Calculations (Even Without a Math Background)
Most people with no math background can handle everyday Excel calculations within a few hours of practice. Excel does the math for you — you just need to know which function to use and how to structure your data.
Realistic time estimates:
- Basic formulas (SUM, AVERAGE, IF): 1–3 hours of practice.
- Intermediate functions (VLOOKUP, SUMIF, pivot tables): A few days of regular use.
- Advanced financial modeling or statistical analysis: Several weeks to a few months.
The learning curve is mostly about understanding how Excel reads data, not about being good at math. If you can describe what you want in plain English (“add up sales for the West region”), there’s almost certainly a function that does exactly that.
How to Use Excel to Calculate Moving Averages
A moving average in Excel smooths out short-term fluctuations to show trends over time. There are two common methods: a manual formula and the built-in Analysis ToolPak.
Manual formula (3-period moving average):
In cell C4, type: =AVERAGE(B2:B4) and drag down. Each row averages the current and two previous values.
Using the Analysis ToolPak:
- Go to Data → Data Analysis.
- Select Moving Average.
- Set your input range, interval (e.g., 3 or 7), and output range.
- Click OK.
Excel also supports Exponential Moving Averages (EMA) through the FORECAST.ETS function, which weights recent data more heavily — useful for sales forecasting.
For visualizing trends, pairing a moving average with a chart makes the pattern much clearer. See how to use Pivot Charts when your data isn’t summarized for chart-building tips.
What Excel Functions Work Best for Data Analysis
For data analysis, the most effective Excel functions are SUMIFS, COUNTIFS, AVERAGEIFS, VLOOKUP/XLOOKUP, INDEX/MATCH, pivot tables, and the newer dynamic array functions like FILTER, SORT, and UNIQUE.
Top picks by use case:
- Summarizing by category: SUMIFS, COUNTIFS, pivot tables
- Looking up values: XLOOKUP (modern) or VLOOKUP (classic)
- Filtering data dynamically: FILTER function (Excel 365/2021+)
- Removing duplicates programmatically: UNIQUE function
- Ranking values: RANK.EQ or LARGE/SMALL
Excel 2024 also introduced the ability to reference dynamic arrays directly in charts, so your charts update automatically when the underlying data changes — no manual adjustments needed. [2]
For rounding results in analysis, the how to round numbers in Excel guide covers ROUND, ROUNDUP, and ROUNDDOWN in depth.
Can Excel Calculate Statistical Significance
Excel can perform basic statistical significance tests, including t-tests, chi-square tests, and ANOVA, using built-in functions and the Analysis ToolPak. It is not a replacement for dedicated statistical software like R or SPSS for complex research, but it handles common business-level statistics well.
Key functions:
=T.TEST(array1, array2, tails, type)— runs a t-test and returns the p-value directly.=CHISQ.TEST(actual_range, expected_range)— chi-square test for independence.- Analysis ToolPak → ANOVA — for comparing means across multiple groups.
Edge case: Excel’s statistical functions assume you understand what test to run and whether your data meets the test’s assumptions (normality, equal variance, etc.). Running the wrong test on the wrong data type is the most common error here.
Is Excel Good for Financial Modeling and Calculations
Excel is the industry standard for financial modeling in banking, corporate finance, and accounting. It handles discounted cash flow (DCF) models, scenario analysis, sensitivity tables, and ratio analysis extremely well.
Where Excel excels (no pun intended):
- Building three-statement financial models (income statement, balance sheet, cash flow)
- Scenario and sensitivity analysis with data tables
- Valuation models (DCF, comparable company analysis)
- Budget vs. actual tracking
For a practical starting point, the balance sheet template in Excel 365 and college budget template for Excel 365 are solid real-world examples.
Where it struggles:
- Datasets over ~1 million rows (use Power Query or a database instead)
- Real-time data feeds without add-ins
- Collaboration on large models with multiple simultaneous editors
What Calculations Can You Not Do in Excel
Excel has real limits. It cannot natively handle real-time streaming data, machine learning model training, relational database queries at scale, or symbolic algebra.
Specific limitations:
- Row limit: 1,048,576 rows per sheet. Larger datasets need Power BI, SQL, or Python.
- Precision: Excel stores numbers with up to 15 significant digits. Calculations requiring higher precision (cryptography, scientific computing) need specialized tools.
- Symbolic math: Excel solves numerically, not symbolically. It can’t simplify algebraic expressions or solve differential equations analytically.
- Real-time data: Without add-ins or Power Query connections, Excel doesn’t pull live data automatically.
- Statistical modeling at scale: For regression on millions of observations or machine learning workflows, Python (scikit-learn) or R are more appropriate.
What Are Common Mistakes Beginners Make With Excel Formulas
The most frequent beginner errors are forgetting the = sign, confusing relative and absolute cell references, and accidentally creating circular references.
Top 6 mistakes and how to fix them:
- Missing the
=sign — Excel treats the entry as text. Always start with=. - Wrong cell references when copying — Use
$A$1(absolute) to lock a reference, orA1(relative) to let it shift. Mix them with$A1orA$1for partial locking. - Circular references — A formula that refers back to its own cell causes an infinite loop. Excel flags these; check Formulas → Error Checking.
- Text stored as numbers — If SUM returns 0 unexpectedly, check whether numbers are formatted as text. Use
VALUE()to convert. - Incorrect order of operations — Excel follows PEMDAS. Use parentheses to control calculation order explicitly.
- Calculation mode set to Manual — If formulas aren’t updating, check that calculation mode is set to Automatic (Formulas tab → Calculation Options). Note: Excel sets the calculation mode based on the first workbook opened in a session, so a manually-set workbook can affect all others opened afterward. [4]
FAQ
Q: How do I start a formula in Excel?
Type = in any cell, followed by your function or expression (e.g., =A1+B1 or =SUM(A1:A10)), then press Enter. [5]
Q: What is the difference between a formula and a function in Excel?
A formula is any expression that starts with =. A function is a named, built-in operation like SUM or AVERAGE that you use inside a formula.
Q: Why is my Excel formula showing as text instead of calculating? The cell is likely formatted as Text. Change the format to General or Number, then re-enter the formula.
Q: How do I calculate a running total in Excel?
In B2, type =B1+A2, then drag down. Each row adds the current value to the cumulative total above it.
Q: Can Excel handle date calculations? Yes. Excel stores dates as serial numbers, so you can subtract dates, add days, and use functions like DATEDIF, EDATE, and NETWORKDAYS. See the guide on finding the difference between two dates in years for practical examples.
Q: What does the $ sign do in an Excel formula?
It locks a row, column, or both when copying a formula. $A$1 always refers to cell A1 regardless of where the formula is pasted.
Q: How do I calculate compound interest in Excel?
Use =P*(1+r)^n, where P is the principal, r is the periodic interest rate, and n is the number of periods.
Q: Does Excel have an automatic recalculation setting? Yes. By default, Excel recalculates all formulas automatically whenever data changes. You can switch to Manual mode under Formulas → Calculation Options if you have a large, slow workbook. [4]
Q: Can I use Excel to calculate taxes? Yes. Nested IF statements or VLOOKUP against a tax bracket table can calculate progressive tax amounts accurately.
Q: What is the fastest way to sum a column in Excel? Click the cell below the column, press Alt + =, and Excel inserts a SUM formula automatically.
Conclusion
Learning how to use Excel to calculate doesn’t require a math degree or years of experience. Start with the core six functions (SUM, AVERAGE, COUNT, IF, VLOOKUP, and basic operators), practice percentage change and SUMIF early, and build from there.
Actionable next steps:
- Open a blank Excel sheet and practice each formula in the basic formulas table above.
- Build a simple budget using SUM and IF — even a grocery list template is a great starting point.
- Try a loan amortization schedule using PMT to see how powerful financial functions can be.
- When you’re comfortable with formulas, explore pivot tables and the FILTER function for data analysis.
- If formulas stop updating, always check your calculation mode first (Formulas → Calculation Options → Automatic).
Excel rewards consistent practice more than any single tutorial. Spend 20 minutes a day applying these functions to real data and the logic becomes second nature fast.
References
[1] Microsoft Excel Now Uses AI to Auto-Suggest Formulas in Real Time – https://www.pcworld.com/article/2903196/microsoft-excel-now-uses-ai-to-auto-suggest-formulas-in-real-time.html
[2] What’s New in Excel 2024 for Windows and Mac – https://support.microsoft.com/en-us/office/what-s-new-in-excel-2024-for-windows-and-mac-faee26b6-ad74-40a8-9304-aa6db716553f
[4] Current Mode of Calculation – https://learn.microsoft.com/fil-ph/troubleshoot/microsoft-365-apps/excel/current-mode-of-calculation
[5] Create a Simple Formula in Excel – https://support.microsoft.com/en-us/office/create-a-simple-formula-in-excel-11a5f0e5-38a3-4115-85bc-f4a465f64a8a