
Click here to view our video tutorial.
Click here to download our PDF tutorial.
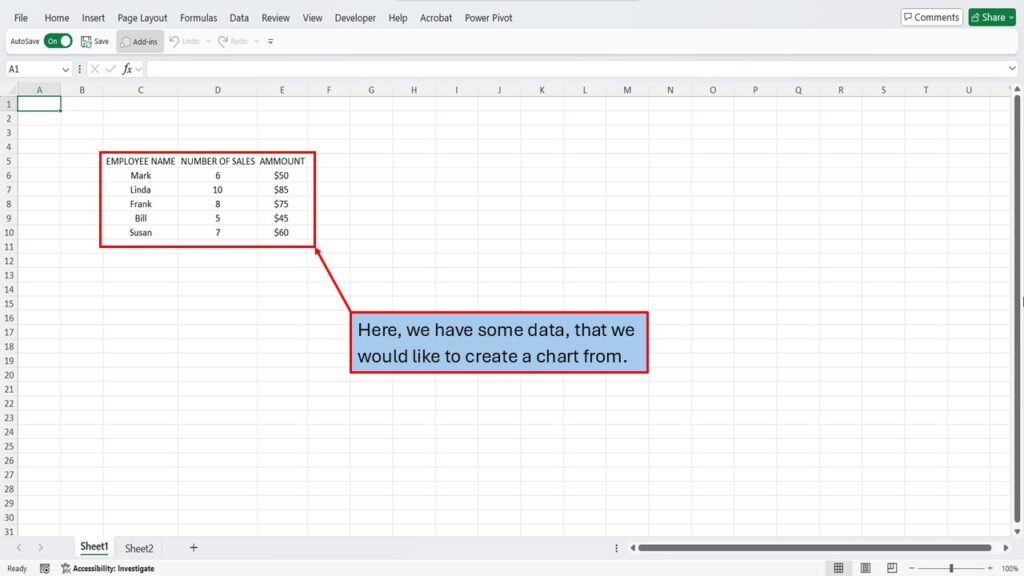
Today we are going to show you how to create a chart from data using only shortcut keys in Excel 365. Let’s get started.
Here, we have some data, that we would like to create a chart from.
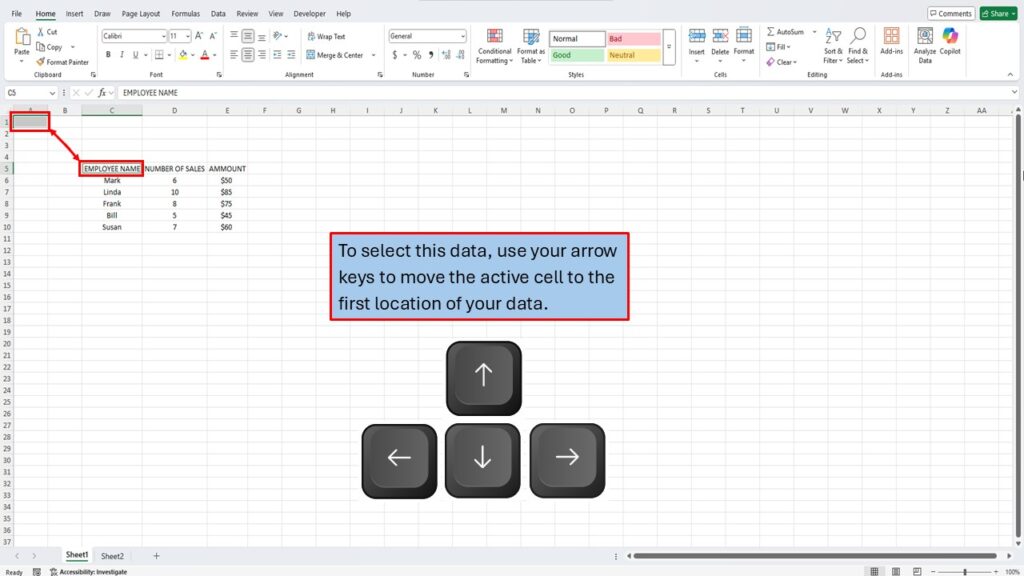
To select this data, use your arrow keys to move the active cell to the first location of your data.
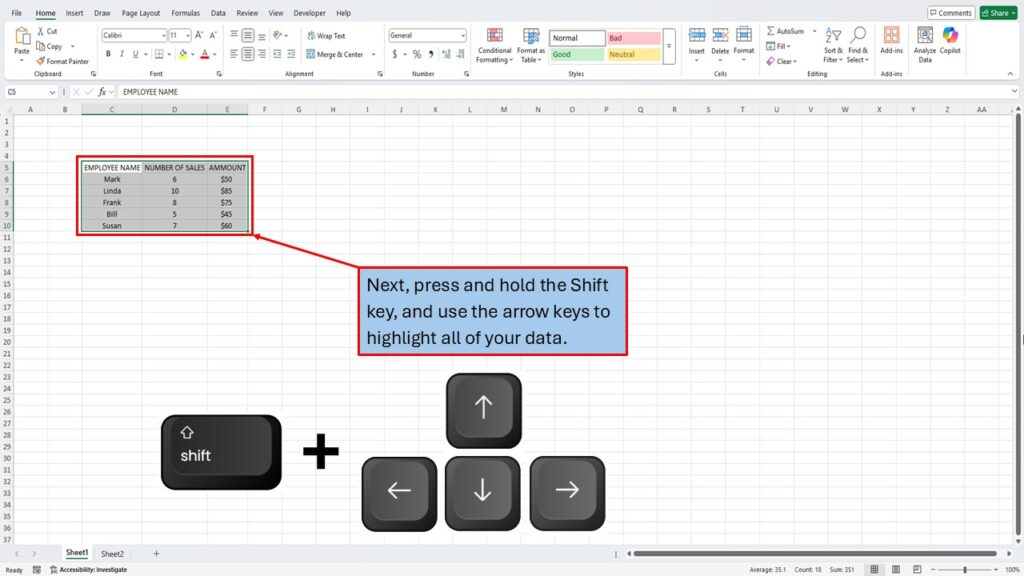
Next, press and hold the Shift key, and use the arrow keys to highlight all of your data.
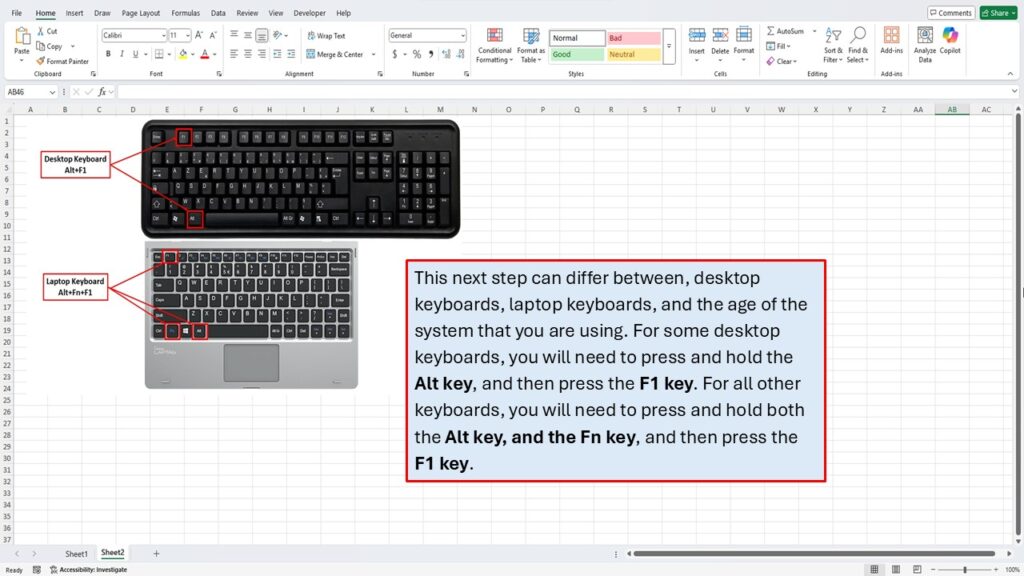
This next step can differ between, desktop keyboards, laptop keyboards, and the age of the system that you are using. For some desktop keyboards, you will need to press and hold the Alt key, and then press the F1 key. For all other keyboards, you will need to press and hold both the Alt key, and the F-N key, and then press the F1 key.
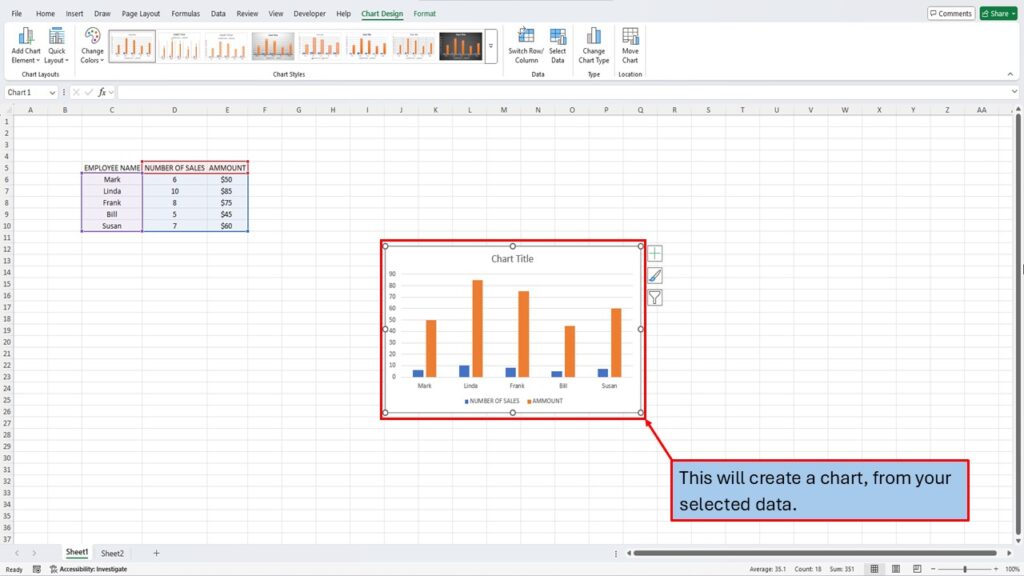
This will create a chart, from your selected data.
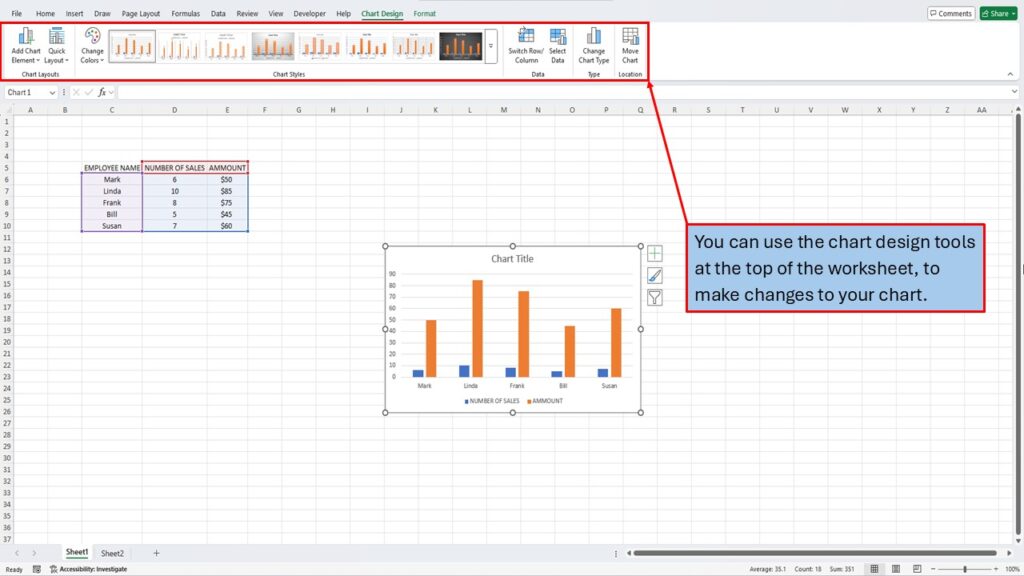
You can use the chart design tools at the top of the worksheet, to make changes to your chart.
Need More Help?
Video Tutorial
PDF Download