
Welcome to Mark’s Excel Tips. Today, I will show you how to create an Infographic Timeline template in Excel. Let’s get started.
Click here to view our video tutorial.
Click here to download our PDF tutorial.
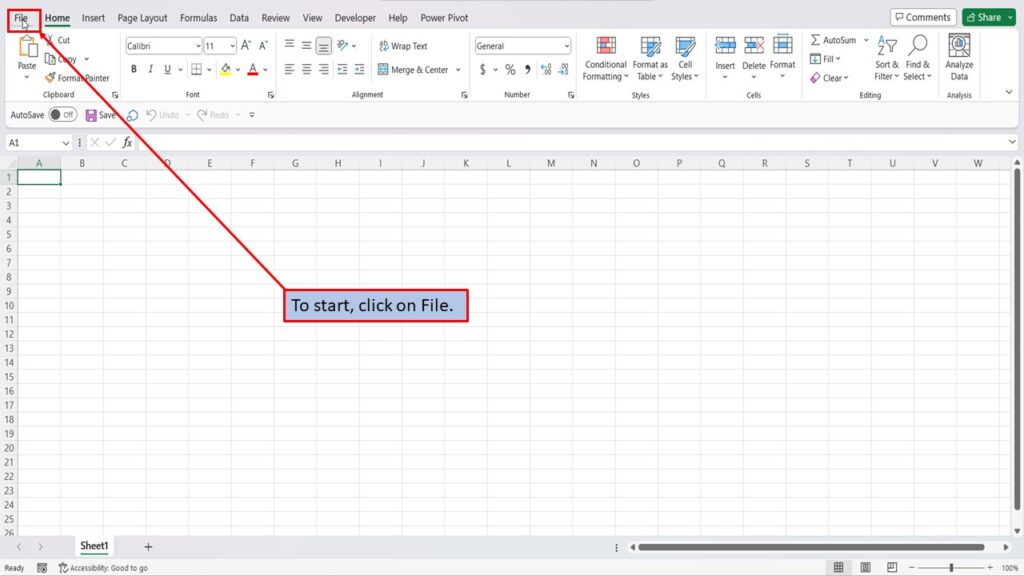
To start, click on File.
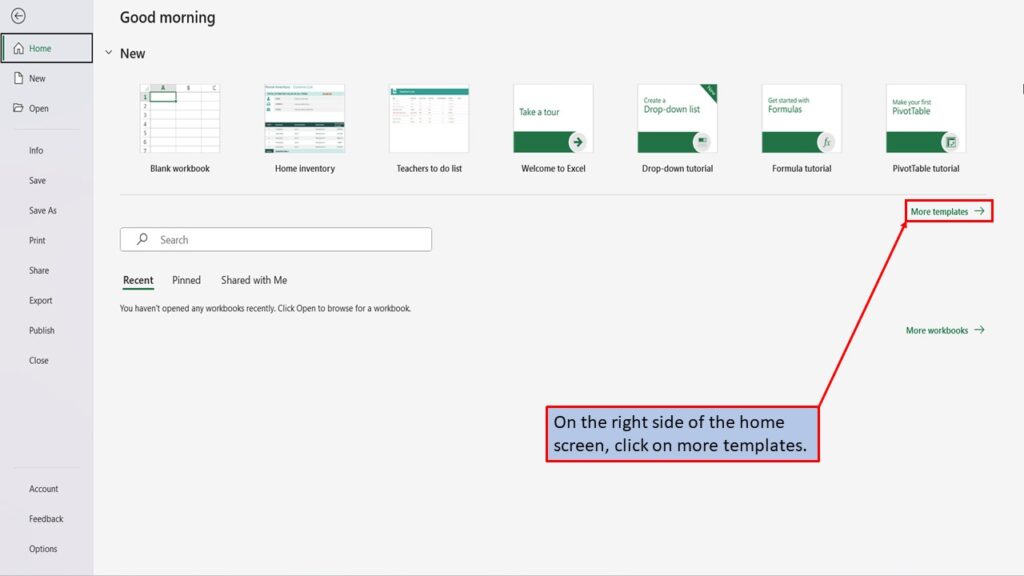
On the right side of the home screen, click on more templates.
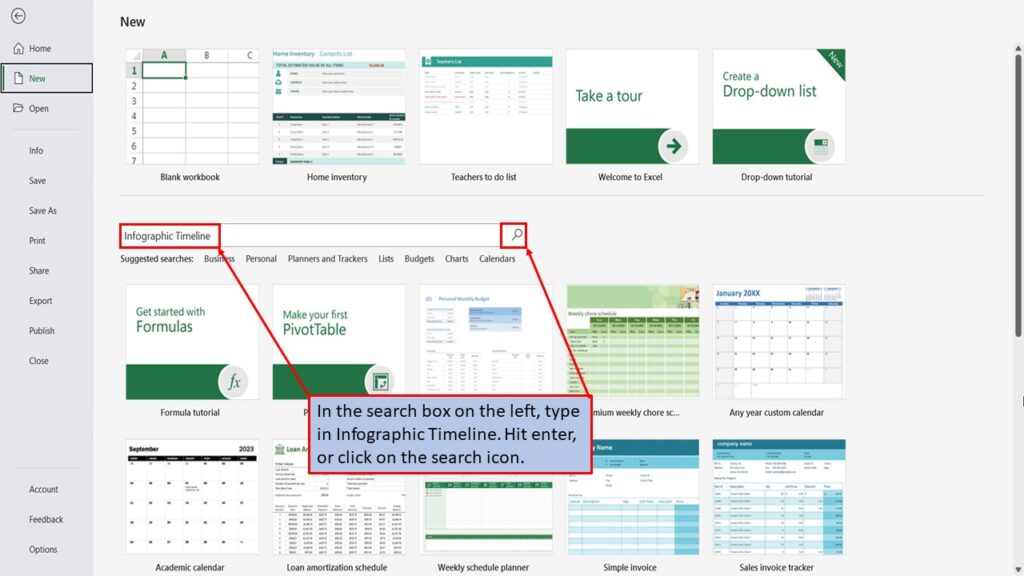
In the search box on the left, type in, Infographic Timeline. Hit enter, or click on the search icon.
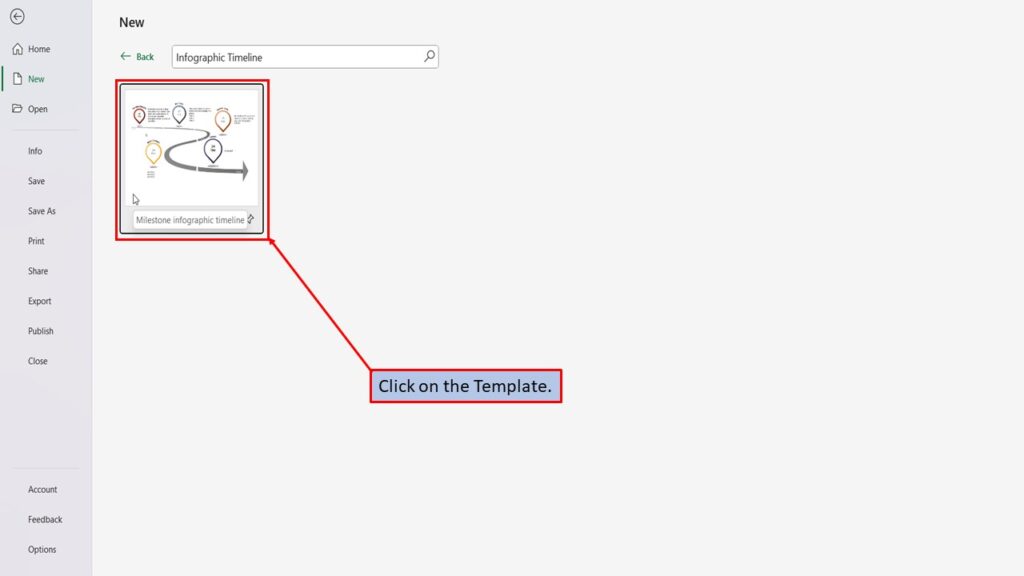
Excel will load a template for an infographic timeline.
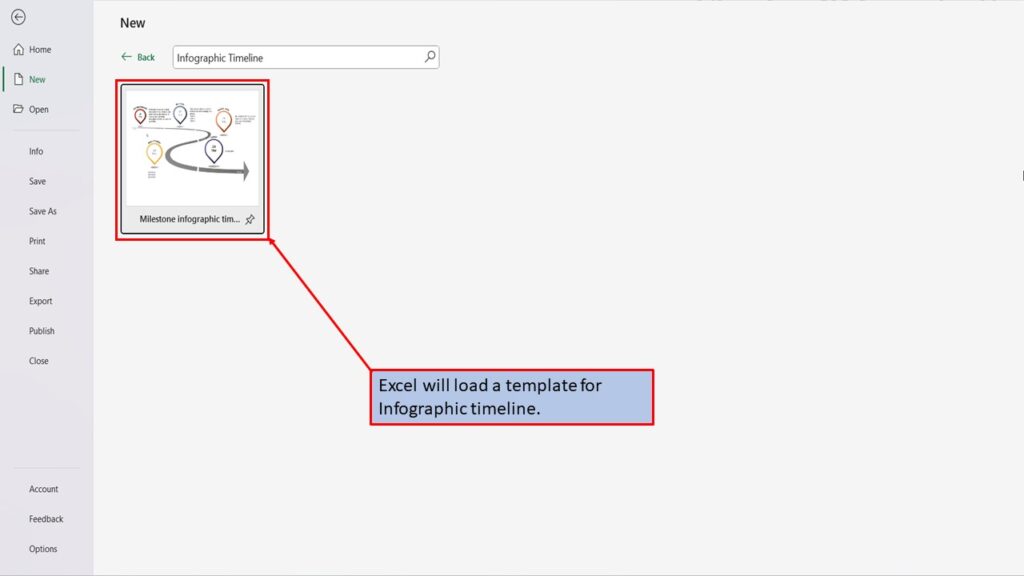
Click on the Template.
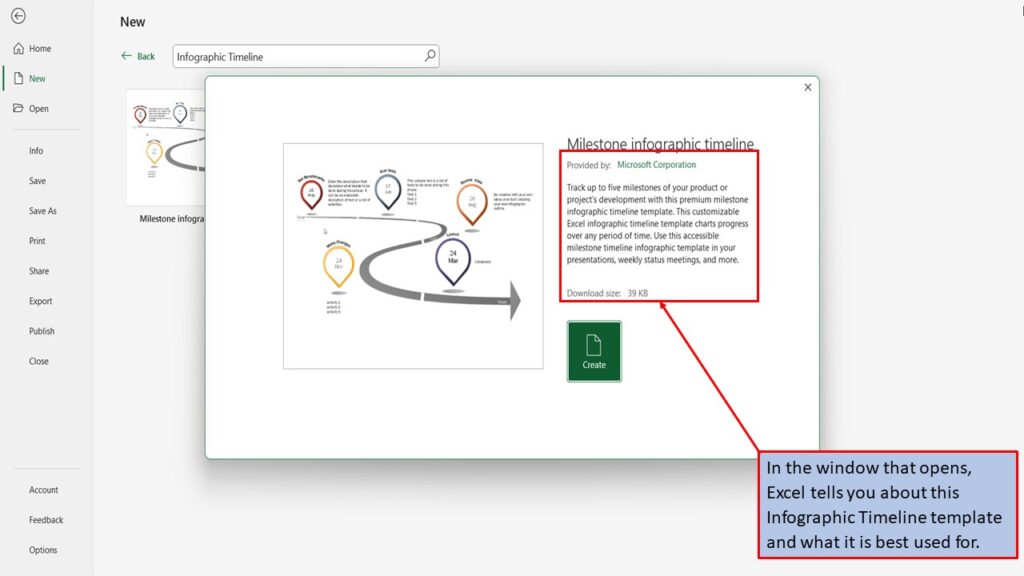
In the window that opens, Excel tells you about this infographic timeline template, and what it is best used for.
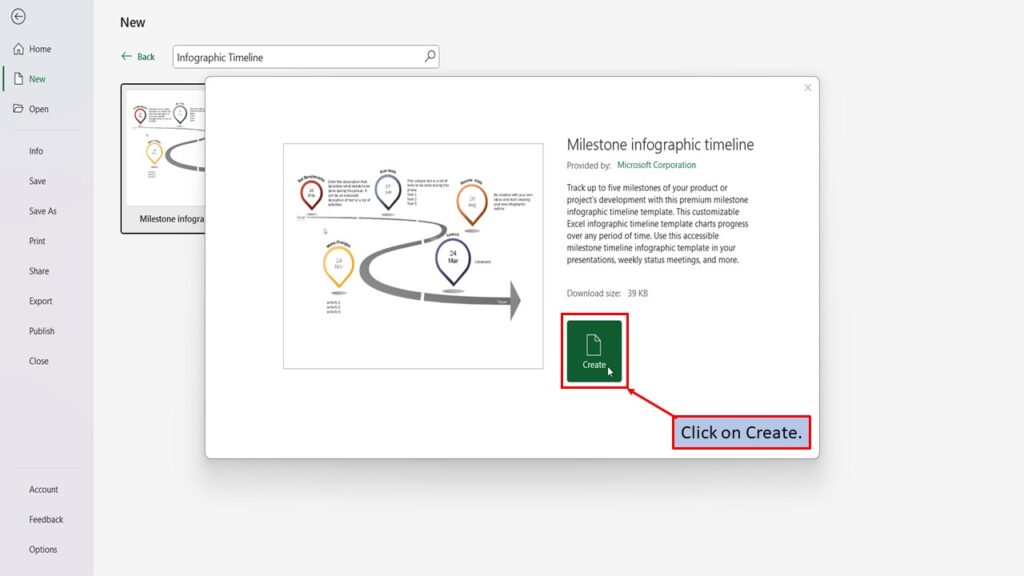
Click on Create.
Excel will load your Infographic timeline template, ready for you to use.
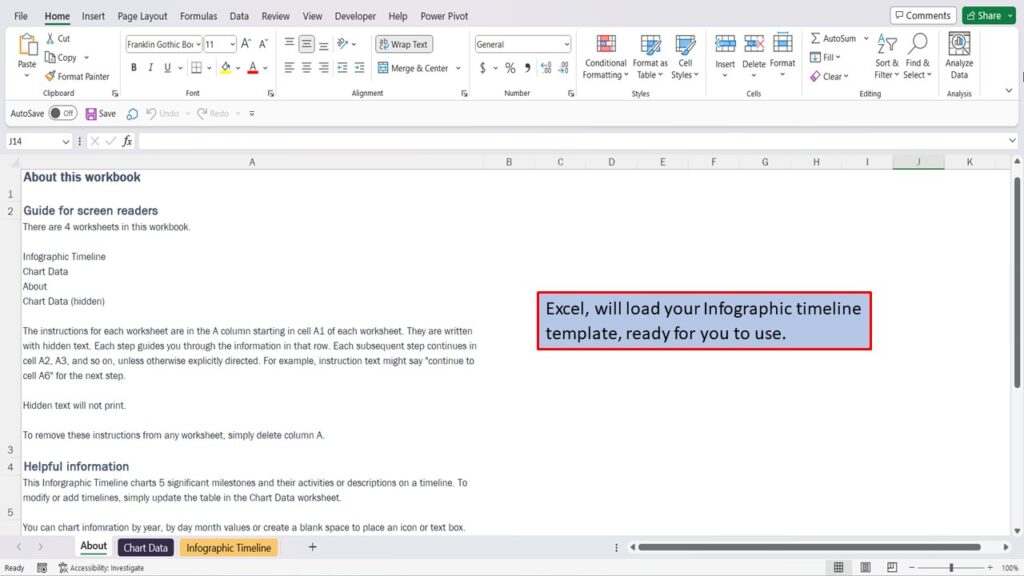
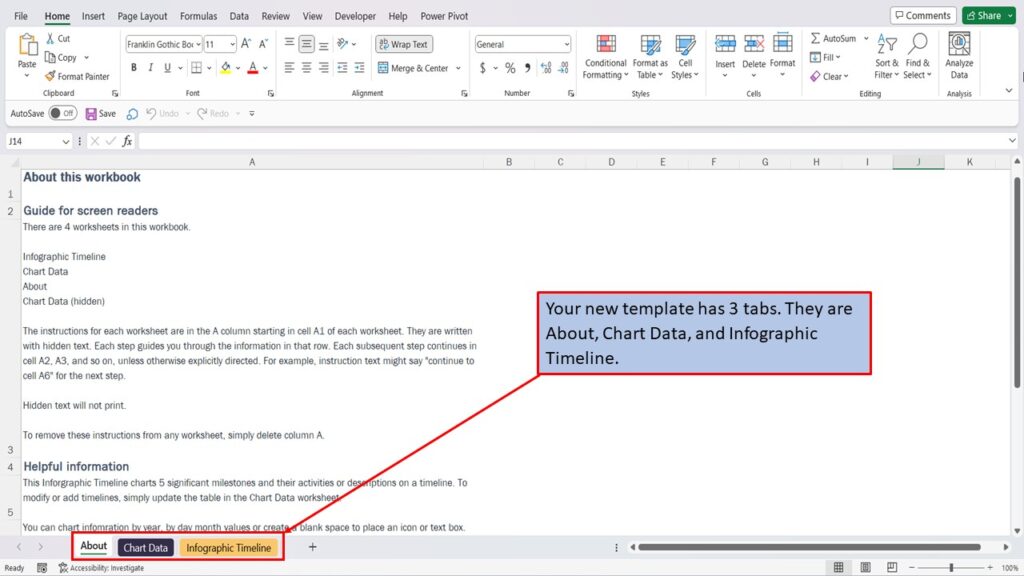
Your new template has 3 tabs. They are, About, Chart Data, and Infographic Timeline.
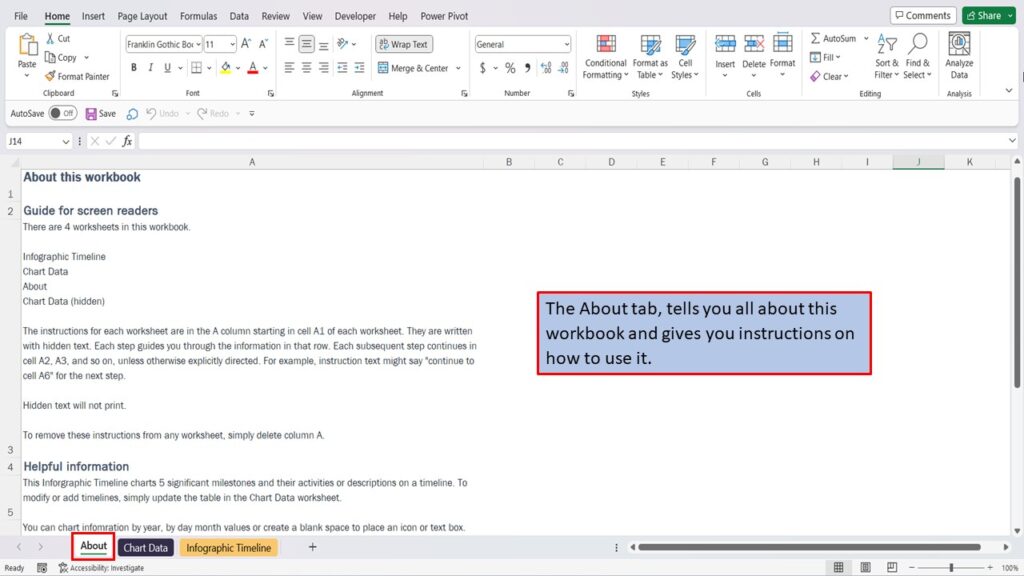
The About tab, tells you all about this workbook and gives you instructions on how to use it.
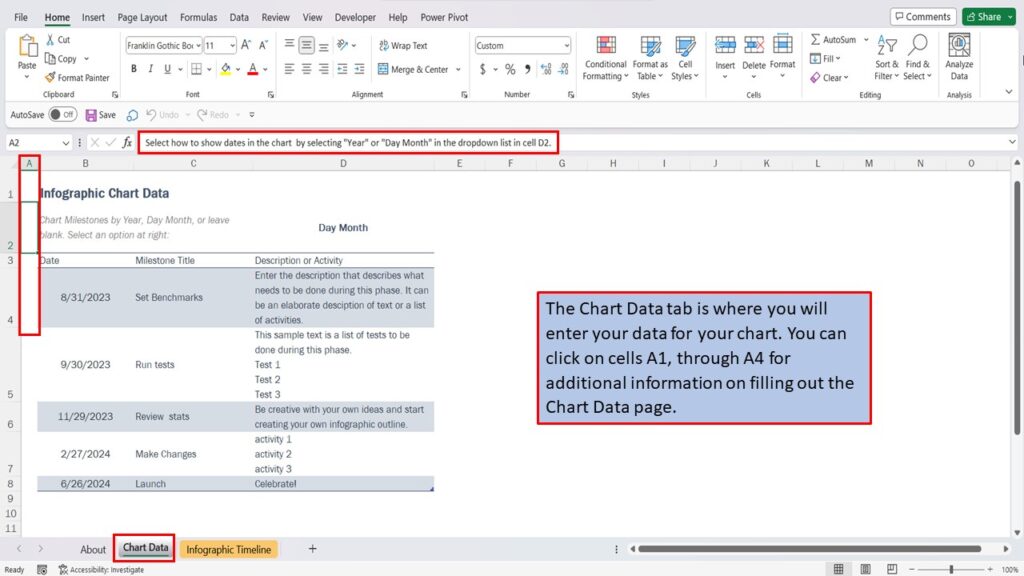
The Chart Data tab, is where you will enter your data for your chart. You can click on cells A1, through A4 for additional information on filling out the Chart Data page.
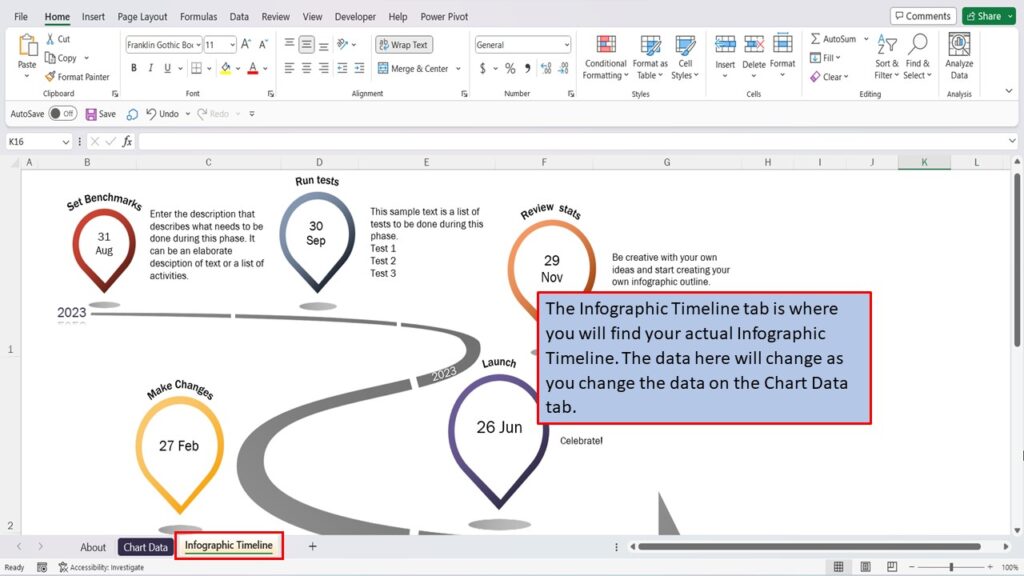
The Infographic Timeline tab, is where you will find your actual Infographic Timeline. The data here will change as you change the data on the Chart Data tab.
View the Video Tutorial.
Download this tutorial in PDF by clicking the Download link below.